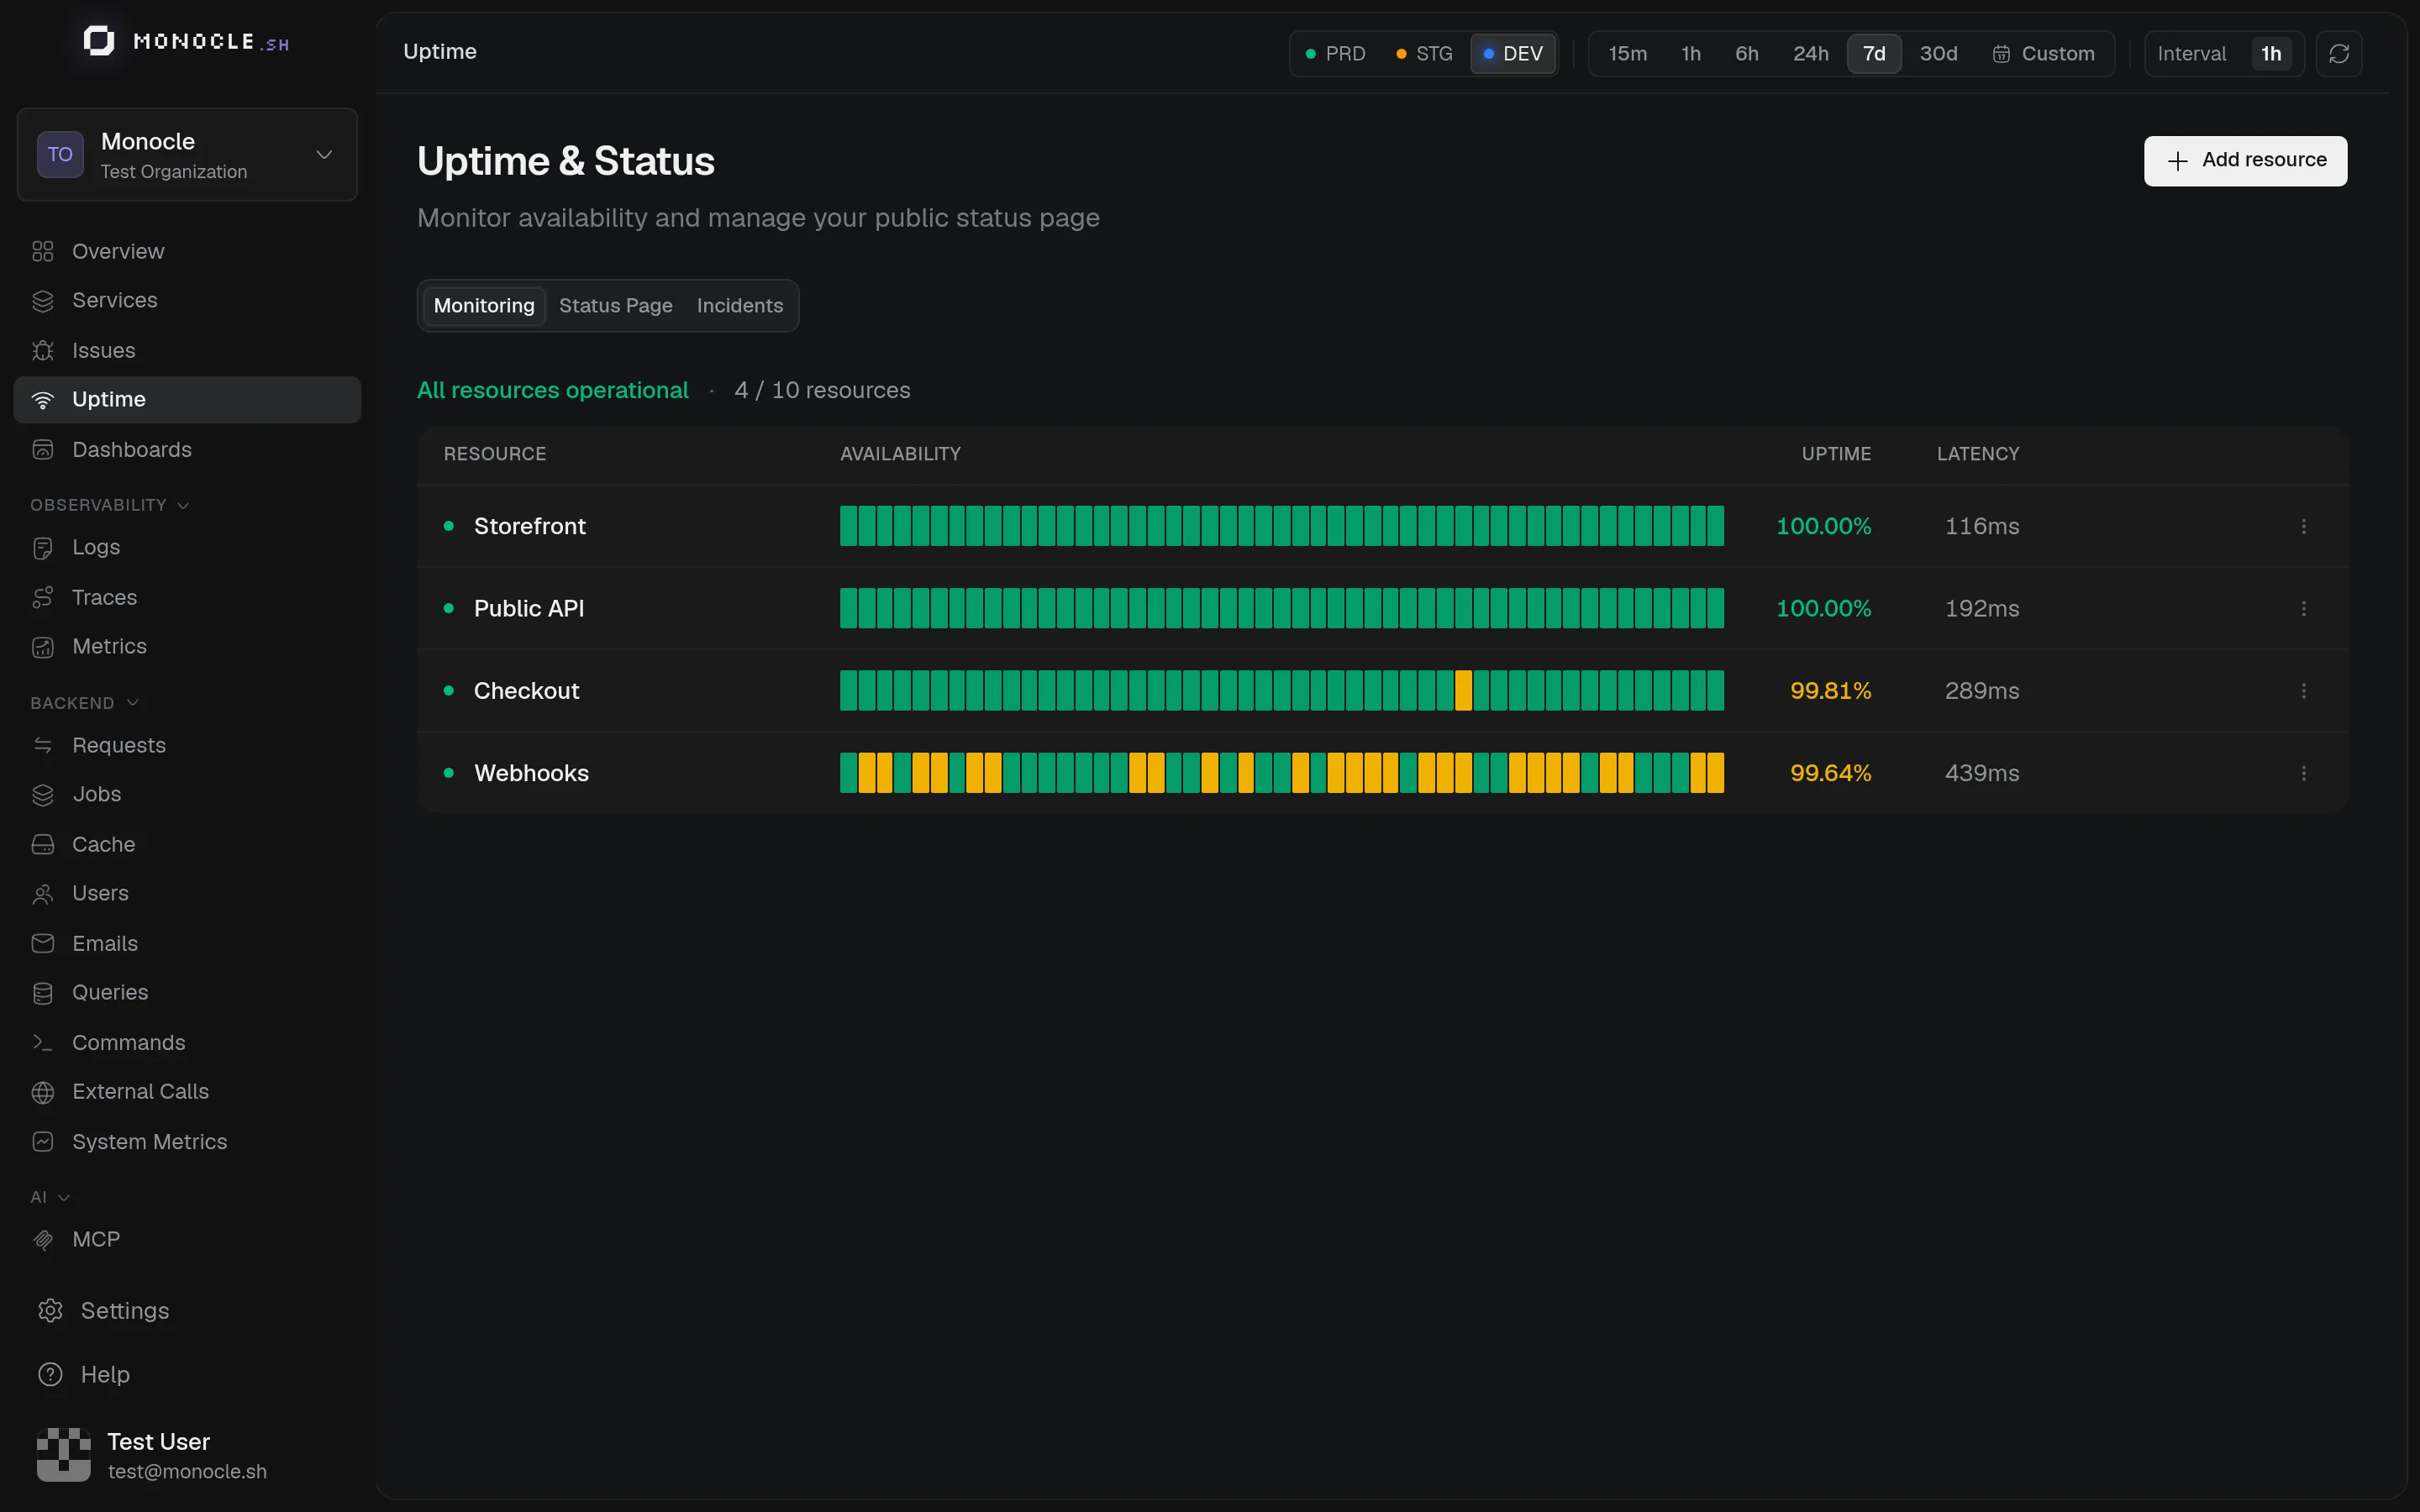
Monocle checks your public endpoints every minute, opens an incident when one stops responding, and notifies your team when it goes down and when it recovers. Monitors also feed your public status page.
Add a monitor
Open Uptime in the sidebar and click Add resource.
| Setting | Default | Description |
|---|---|---|
| Name | Shown on your status page and in notifications | |
| Description | none | Optional. Shown to customers next to the resource name on the status page |
| URL | The full URL to check, starting with http:// or https:// | |
| Health mode | off | Read the response body to detect failing dependencies. See Health Mode. |
| Show on status page | on | Turn off for internal checks you don't want to expose publicly |
| Timeout | 10s | How long to wait for a response, DNS resolution included (1 to 30 seconds) |
| Custom headers | none | Headers sent with each check, for example an Authorization token |
| Incidents | 3 and 1 | Open an incident after 3 failed checks in a row, resolve it after 1 successful check (1 to 10 each) |
| Default channels | on | The monitor notifies the organization's default channels for Uptime. Turn it off to pick the channels of this monitor. |
Click Run a test check in the panel on the right to check the URL before saving. The panel shows the response and the equivalent request.
Each environment can have up to 10 monitors. Contact us if you need more.
How checks work
- Every minute, Monocle sends a
GETrequest to each monitor, with theMonocle-Uptime/1.0user agent. - A check succeeds when the endpoint answers with a status between 200 and 399. Redirects are not followed.
- A check that times out is retried once right away. Other errors are not retried.
- Private, loopback, and reserved IP addresses can't be monitored: the URL must be reachable from the internet.
- A host name that doesn't resolve, such as an expired domain, fails the check with a DNS error, shown as DNS resolution failed.
When a check fails, its error type is recorded: timeout, dns, connection, tls, or http. Failed checks also keep the response body and headers to help you understand what happened.
Incidents and alerts
Under Incidents, the first number sets how many failed checks in a row open an incident, and the second how many successful checks in a row resolve it. A higher first number avoids alerts on short network hiccups. Keeping the second at 1 gives the fastest recovery notice.
When a monitor goes down and when it recovers, every member with access to the project receives an email and an in-app notification. Each member can turn off the email in their email preferences. The monitor also posts to its notification channels: Slack, Discord, or webhooks. Notifications name the monitor, such as Monitor API health is down, and include its URL.
Monitor details
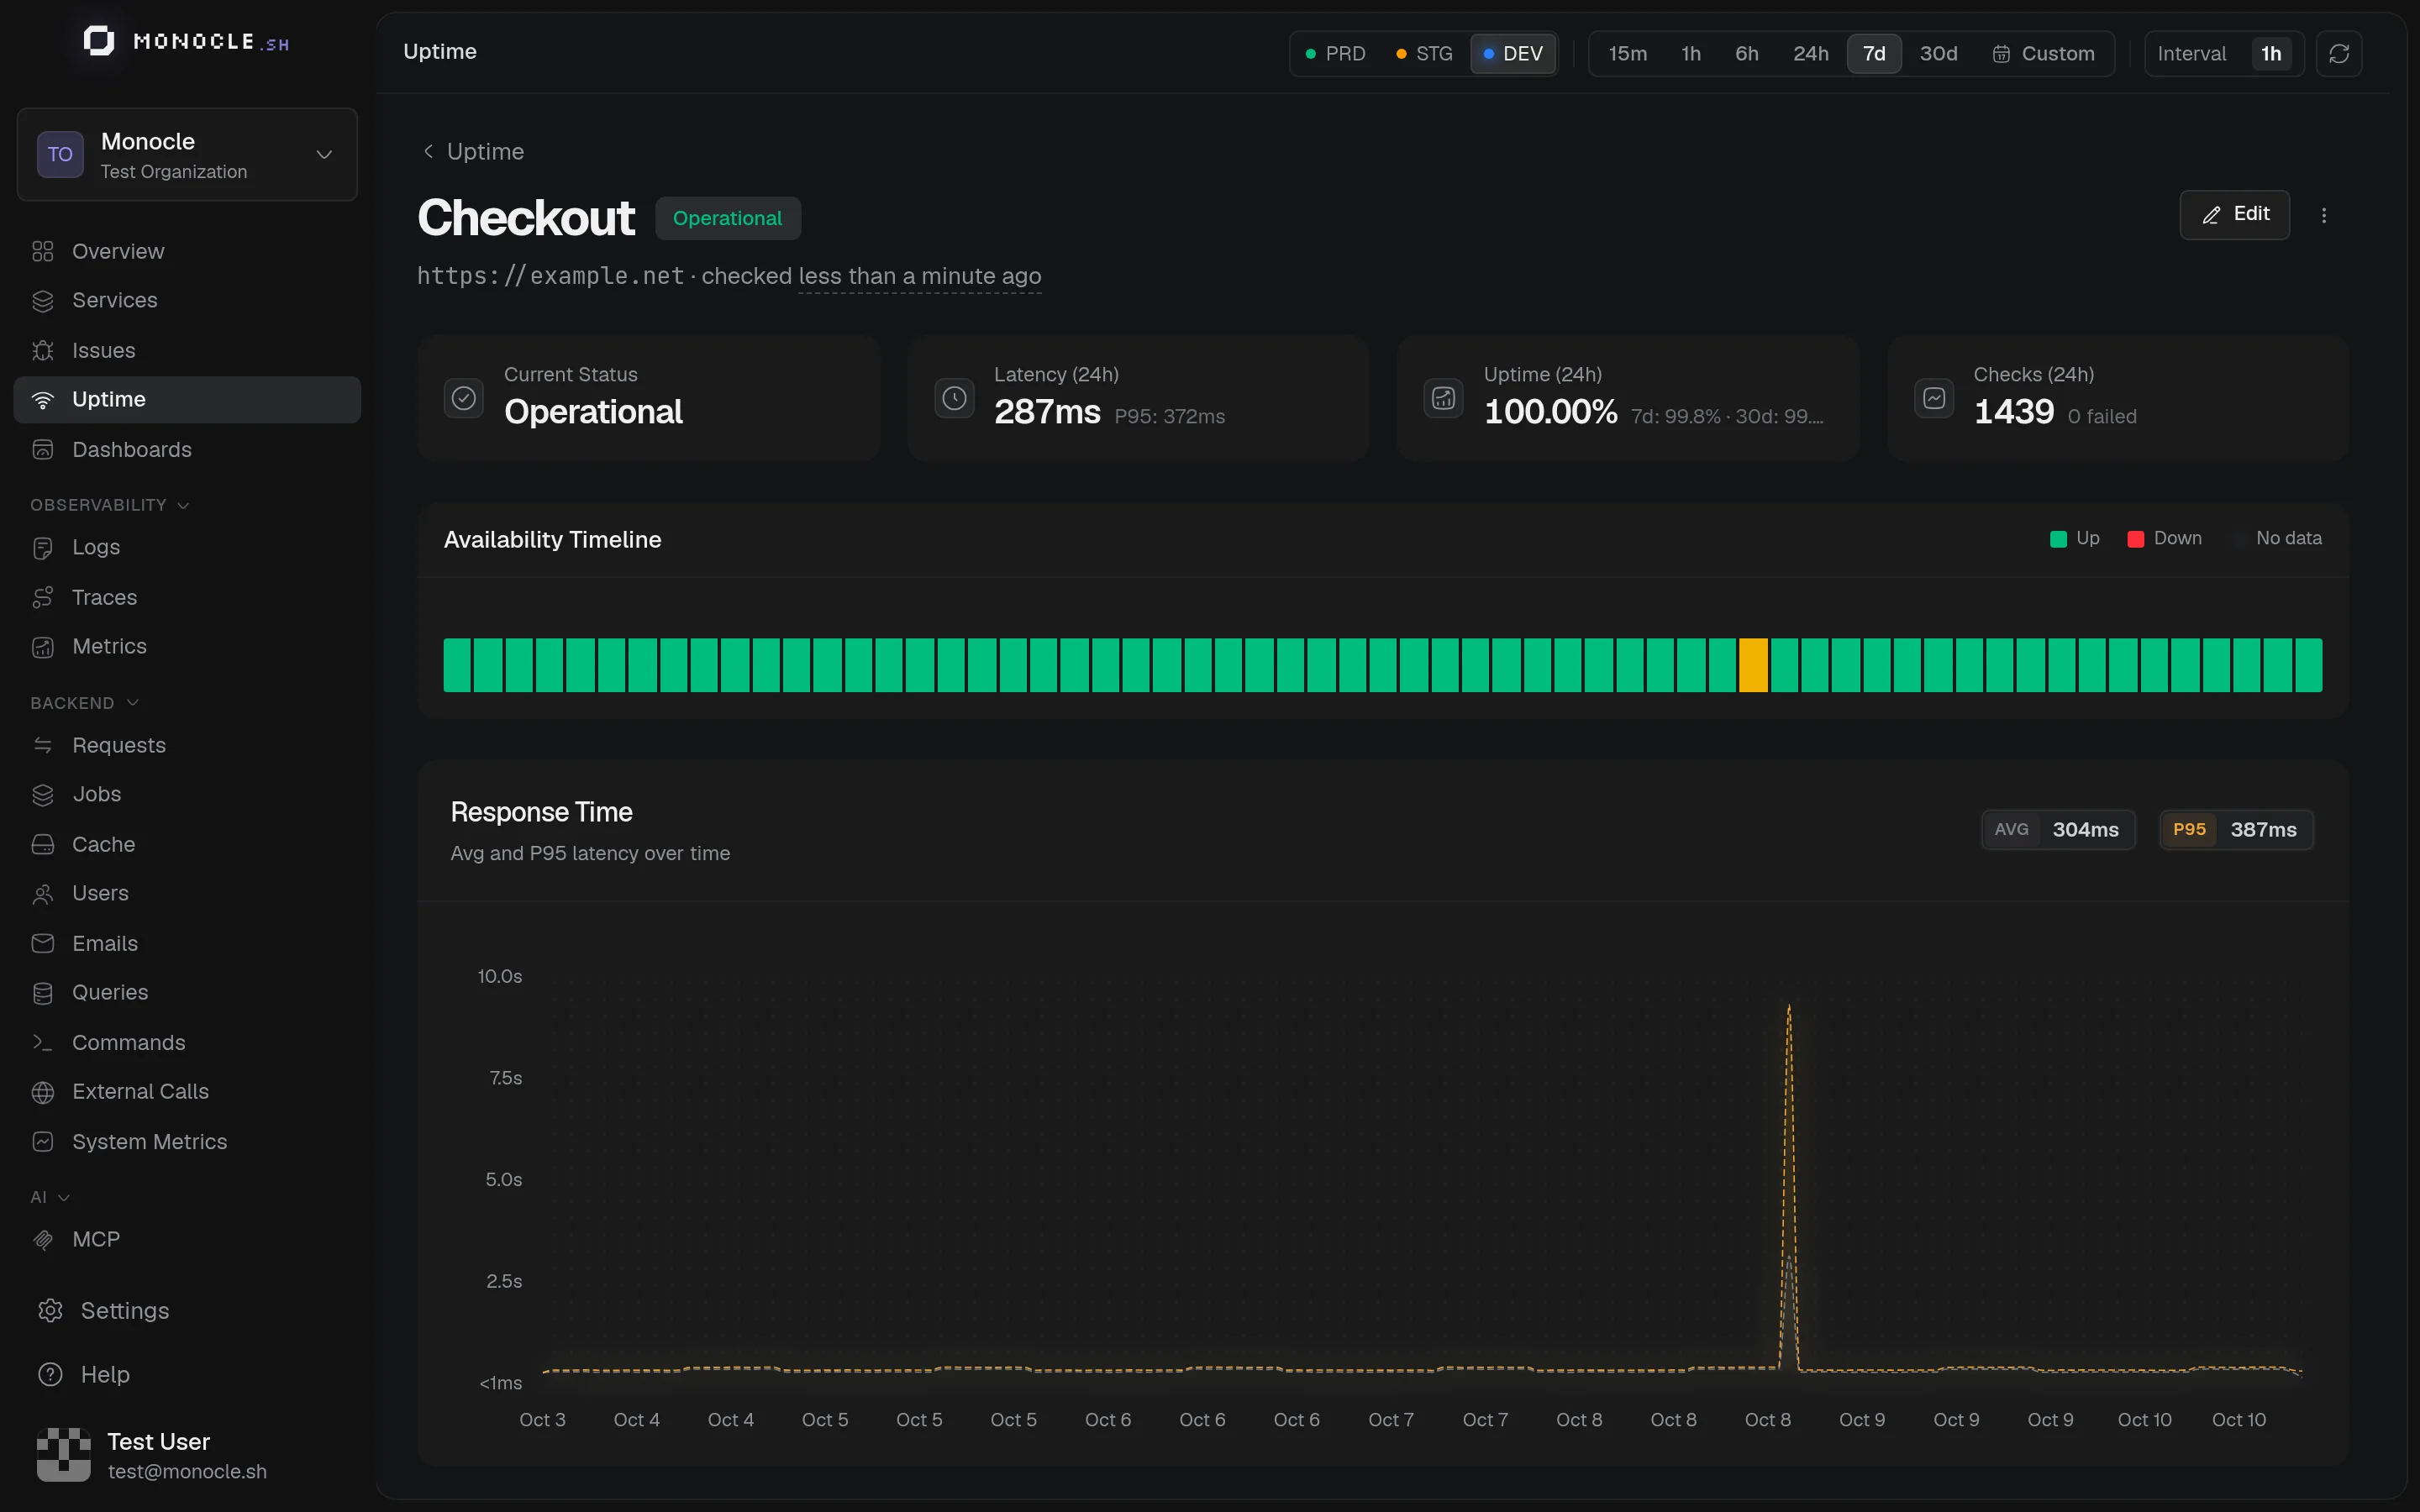
Click a monitor to see its current status, response time, uptime percentage, and number of checks over the selected range. The Availability Timeline shows each period as up, warning, down, or without data. Click a period to see its average and P95 response time, success rate, and, in Health Mode, the result of each health check.
Check results are kept for 90 days.
Health Mode
An endpoint can answer 200 OK while its database is down. Health Mode lets Monocle read a structured health report in the response body and fail the check when your application reports itself unhealthy.
The response must be JSON with at least an isHealthy boolean and a checks array:
{
  "isHealthy": true,
  "status": "ok",
  "finishedAt": "2026-01-01T20:50:11.945Z",
  "checks": [
    {
      "name": "Database health check (postgres)",
      "status": "ok",
      "message": "Successfully connected to the database server",
      "meta": { "connection": { "name": "postgres", "dialect": "postgres" } }
    },
    {
      "name": "Redis health check (main)",
      "status": "warning",
      "message": "Memory usage is above 80%"
    }
  ]
}| Field | Required | Description |
|---|---|---|
isHealthy | Yes | The check fails when false |
checks | Yes | One entry per dependency |
checks[].name | No | Name of the dependency |
checks[].status | No | ok, warning, or error. Warnings are highlighted on the timeline. |
checks[].message | No | Explanation shown in the check details |
checks[].meta | No | Any extra data |
A Health Mode check succeeds only when the status code is between 200 and 399 and isHealthy is true. A body that isn't valid JSON fails the check.
With AdonisJS
This is the format returned by the AdonisJS health checks module. Expose its report on a route and point your monitor at it with Health Mode turned on.