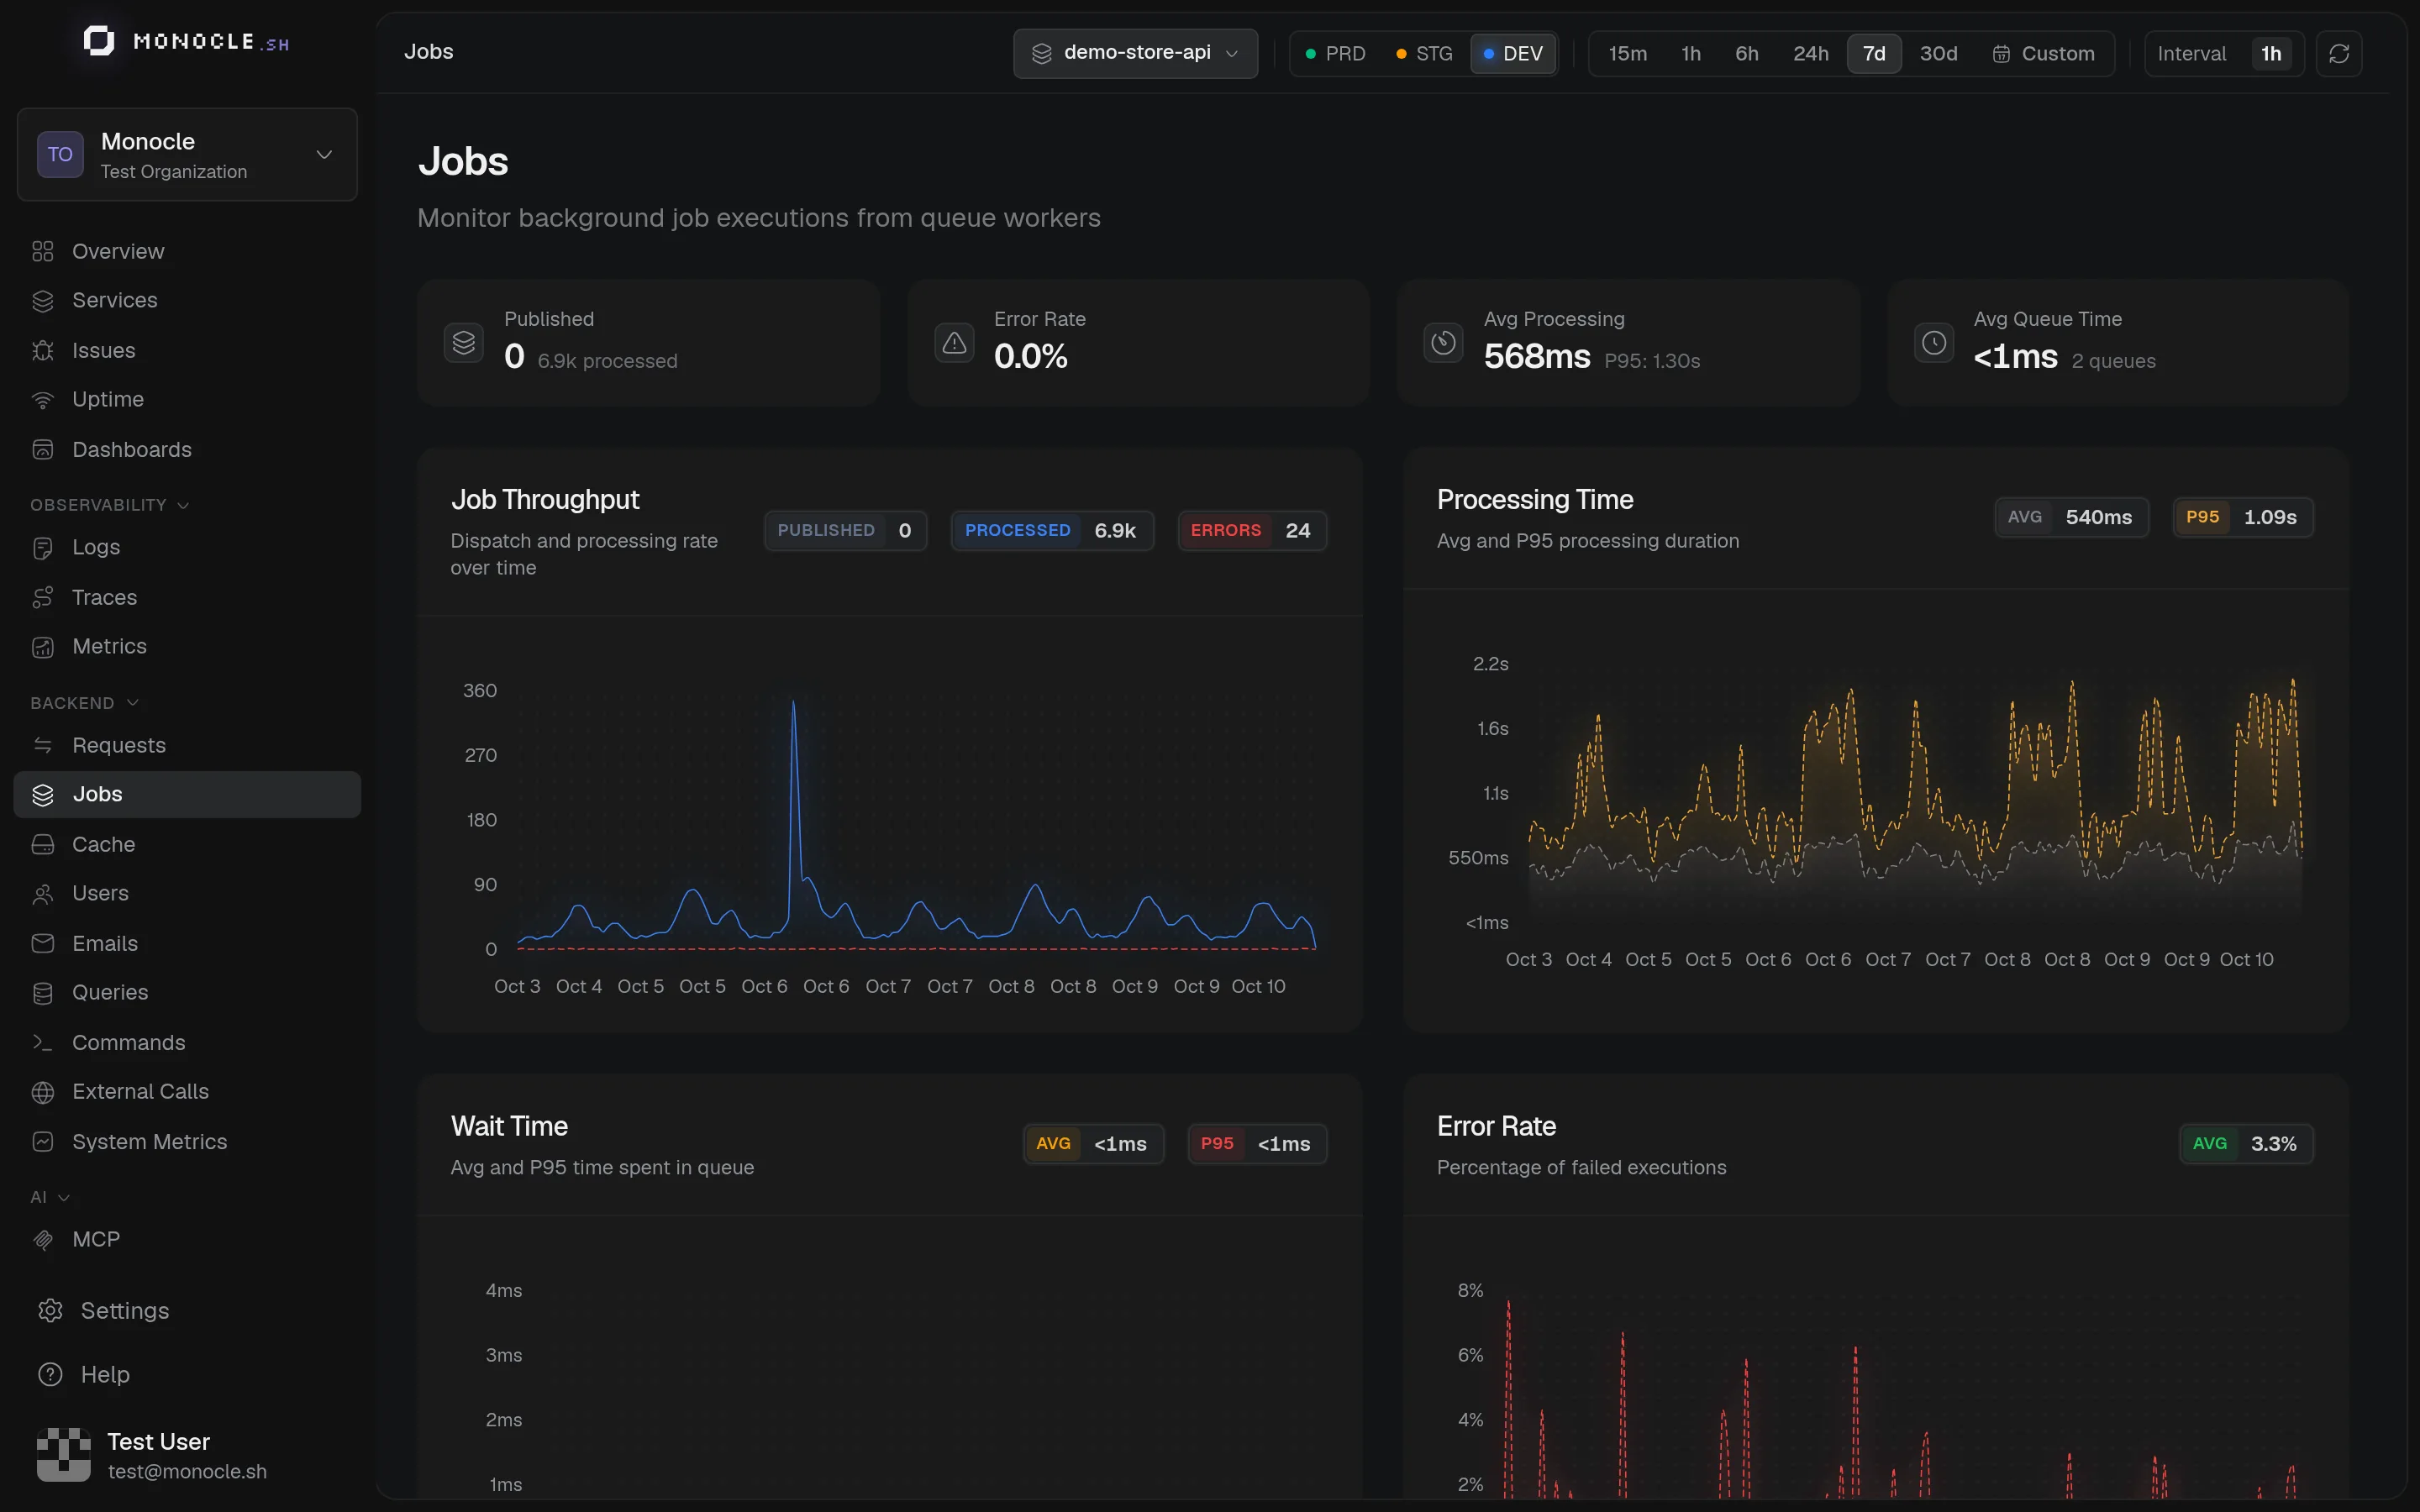
Monocle tracks your background job activity with a dedicated Jobs dashboard. You get visibility into job throughput, error rates, processing times, and queue delays across all your queues.
What Monocle tracks
- Throughput over time with success/error breakdown
- Error rate trends to spot problematic jobs
- Processing time (average and P95) per job
- Queue time between dispatch and processing start
- Retry attempts and failure reasons
- Per-job detail pages with recent executions and error breakdown
How it works
Monocle creates two types of spans for each job:
- A producer span when a job is dispatched (enqueued)
- A consumer span when a job is processed by a worker
These spans carry standardized OpenTelemetry Messaging Semantic Conventions attributes, so the Jobs dashboard can aggregate metrics regardless of which queue library you use.
Span attributes
All job instrumentations must emit these attributes for the Jobs dashboard to work correctly.
Standard semconv attributes
These follow the official OpenTelemetry Messaging Semantic Conventions:
| Attribute | Description |
|---|---|
messaging.system | Queue system identifier (e.g., "bullmq") |
messaging.destination.name | Queue name |
messaging.operation.type | "send" for producers, "process" for consumers |
messaging.operation.name | Operation name (e.g., Queue.add, Worker.run) |
messaging.message.id | Job ID |
messaging.client.id | Worker name (consumer spans) |
messaging.batch.message_count | Number of jobs in bulk operations |
messaging.message.retry.count | Number of retry attempts |
Monocle attributes
These custom attributes power specific dashboard features:
| Attribute | Dashboard Feature |
|---|---|
messaging.job.name | Job name grouping, per-job detail page |
messaging.operation.type | Distinguishing published vs processed jobs in throughput charts |
messaging.job.queue_time_ms | Queue time metrics and charts |
entry_point.type = "job" | Identifies the span as a job entry point, used for dashboard routing |
Supported libraries
Redis-backed job queue with priorities, retries, rate limiting, and flows
Lightweight job queue for Node.js. Instrumentation is built into the Monocle agent when
@boringnode/queue is installed.
Getting started
Each instrumentation page covers setup with the AdonisJS agent and with a standalone OpenTelemetry SDK. @adonisjs/queue is traced by the AdonisJS agent out of the box, see Mail, Queue & CLI.
Sampling high-volume jobs
If one job runs very often or creates very large traces, use job sampling to reduce trace volume for successful executions while keeping failed executions.
import { defineConfig, Sample } from '@monocle.sh/adonisjs-agent'

export default defineConfig({
  // ...
  sampling(ctx) {
    if (ctx.kind === 'job' && ctx.name === 'SendNewsletterEmail') {
      return Sample.rate(0.01).keepErrors()
    }

    return Sample.default()
  },
})