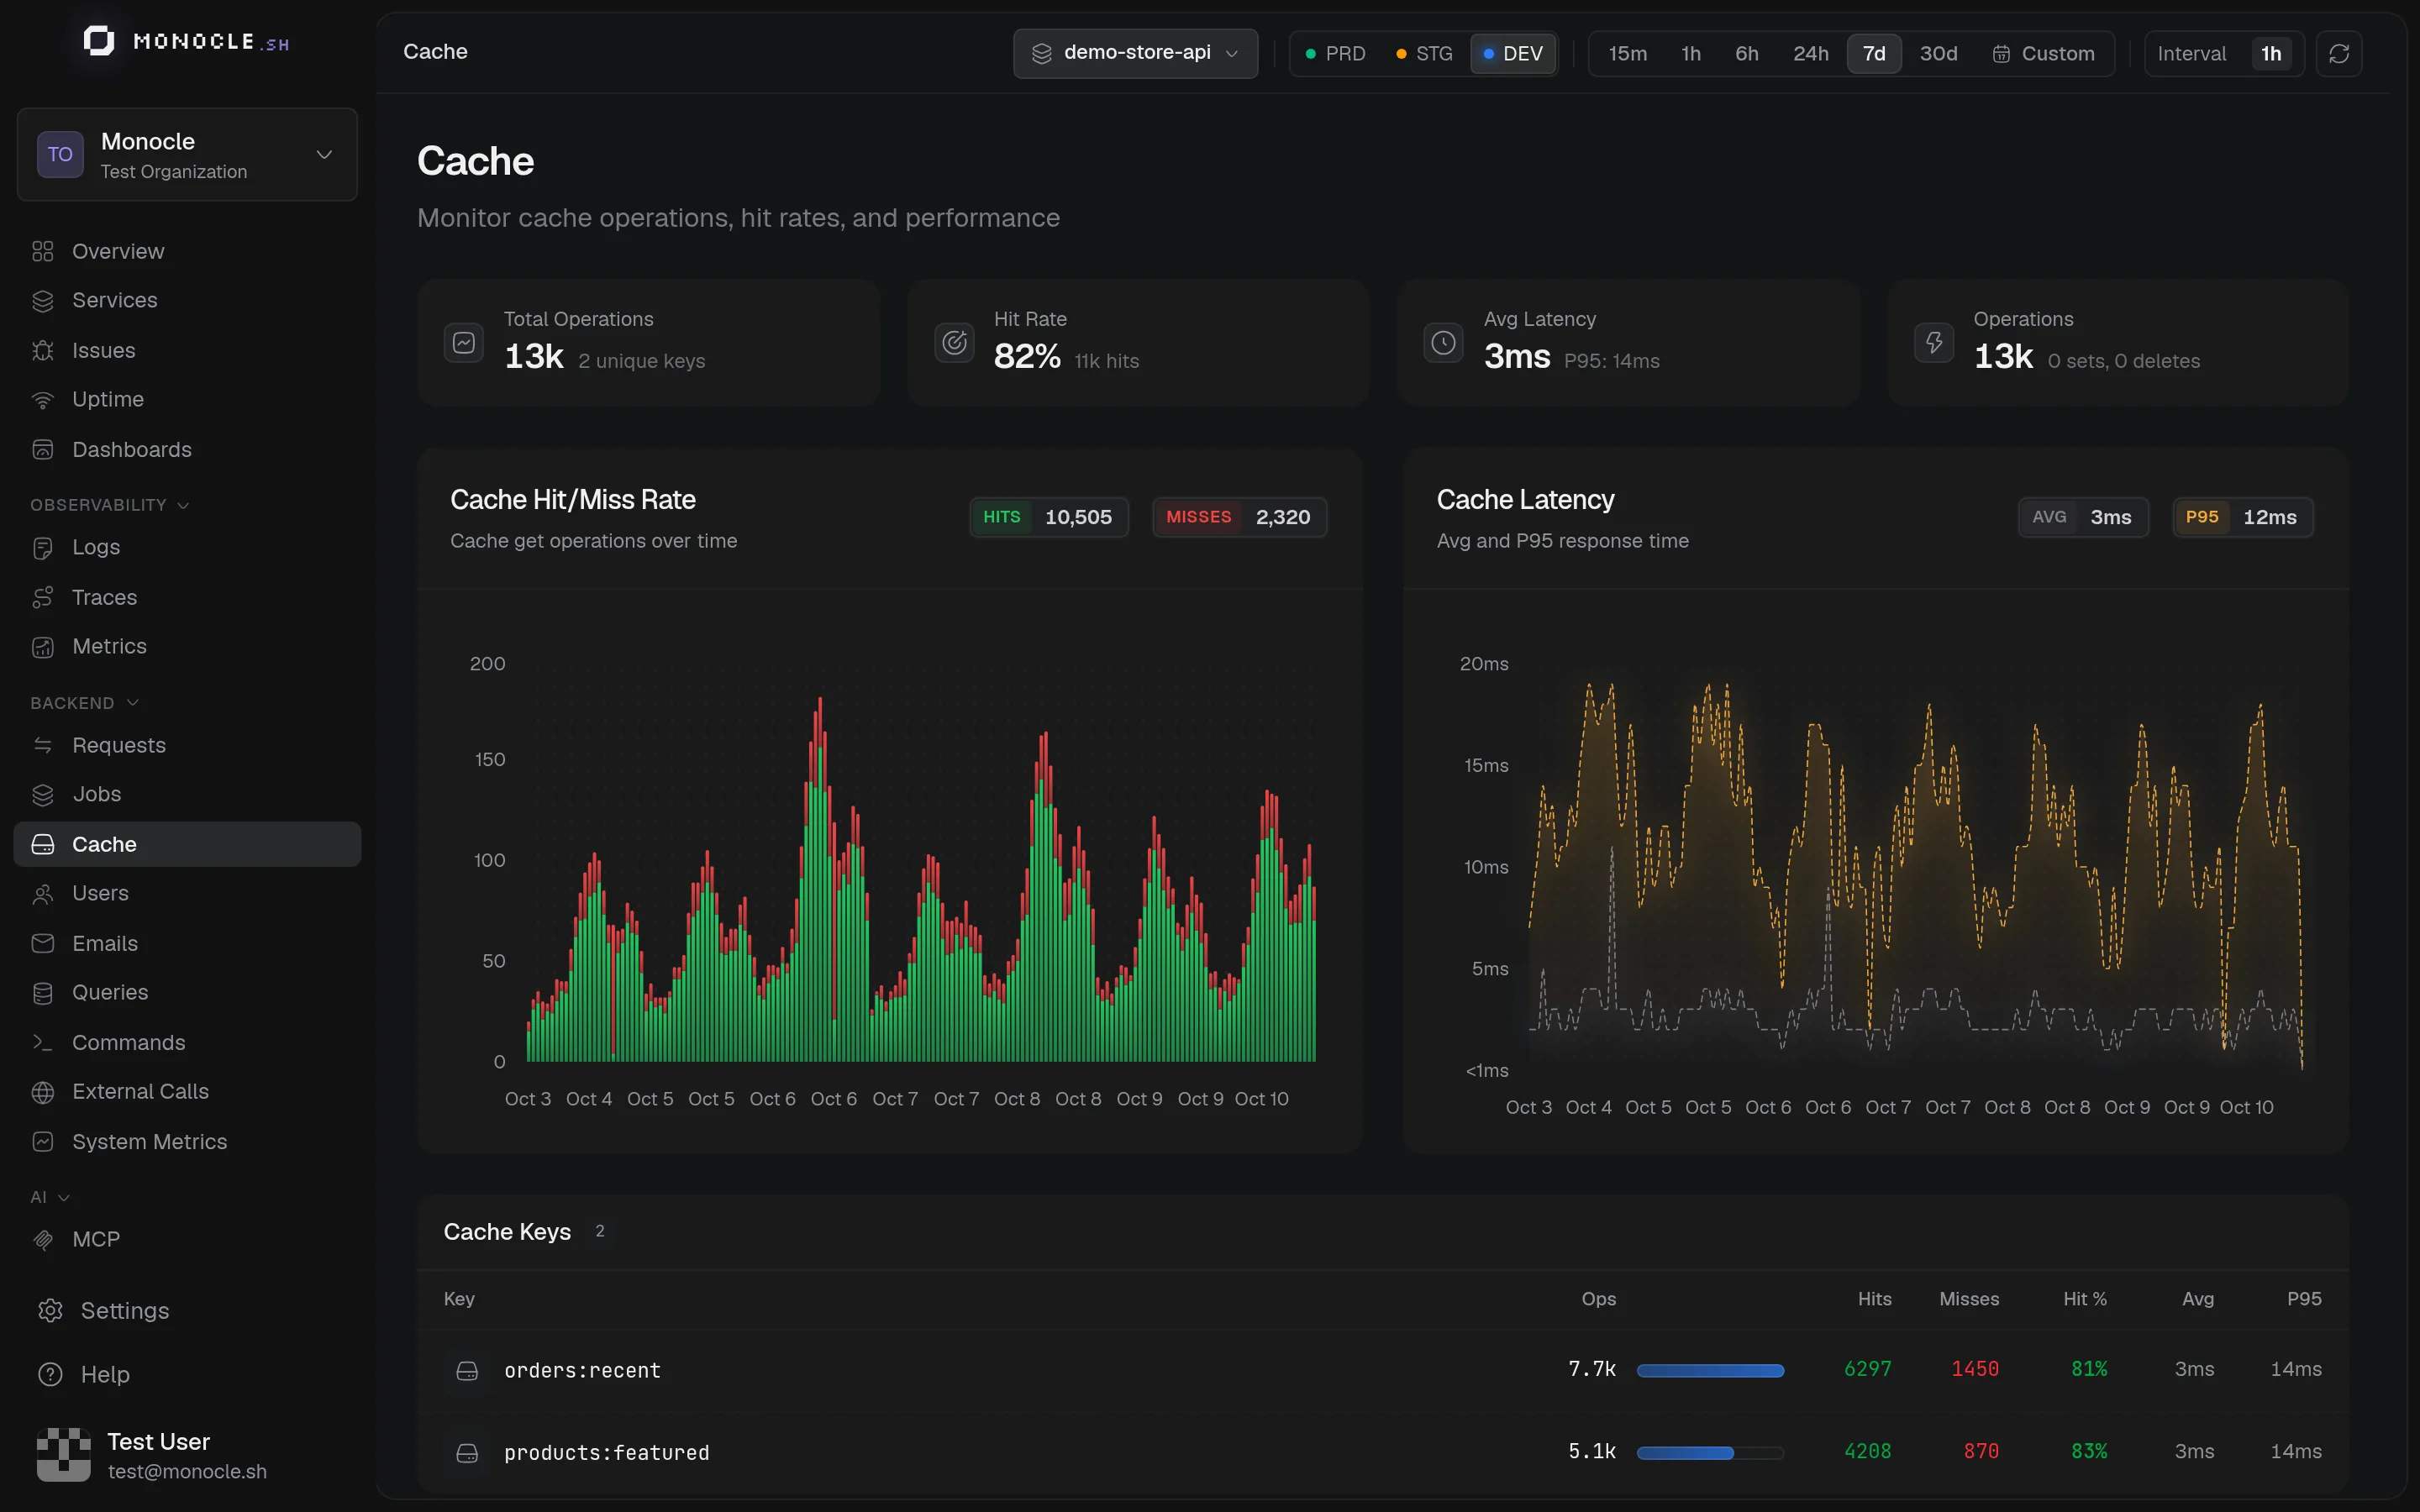
Monocle provides a dedicated Cache dashboard for monitoring your cache layer. See how your cache is performing at a glance and identify which keys need attention.
What Monocle tracks
- Hit rate with color-coded percentage (green for healthy, red for low)
- Total operations count and average/P95 latency
- Hit/miss chart showing cache efficiency over time
- Latency chart tracking response time trends
- Per-key breakdown with individual hit/miss ratio and latency metrics
Key sanitization
Cache keys often contain dynamic values (user IDs, UUIDs, session tokens) that would create high-cardinality attributes. Monocle automatically sanitizes keys by replacing dynamic segments with *:
users:550e8400-e29b-41d4-a716-446655440000becomesusers:*post:12345becomespost:*hash:a1b2c3d4e5f6becomeshash:*
This keeps the per-key table useful instead of showing thousands of unique entries. You can provide a custom sanitizer if the defaults do not match your key format.
Span attributes
All cache instrumentations must emit these attributes for the Cache dashboard to work correctly.
| Attribute | Dashboard Feature |
|---|---|
cache.operation | Operation type grouping (get, set, getOrSet, delete, etc.) |
cache.key | Per-key breakdown table (sanitized) |
cache.hit | Hit rate calculation and hit/miss charts |
cache.store | Cache store identification |
Supported libraries
Getting started
The Bentocache page covers setup with the AdonisJS agent, including caches created through @adonisjs/cache.