Monocle groups the exceptions reported by your services into issues. Thousands of occurrences of the same bug become a single issue, with its stack trace, the requests and users it affected, and a status your team can act on.
How issues are created
There is nothing to set up. When an exception is reported, Monocle computes its fingerprint and attaches it to the matching issue, or opens a new one. The issue is titled after the exception type and message, such as PaymentTimeoutError: Payment provider timed out.
An issue belongs to the project and is shared by all environments: its status, priority, and assignees are the same everywhere. Its statistics (occurrences, users, trend) follow the environment, services, and time range selected in the header.
The issues list
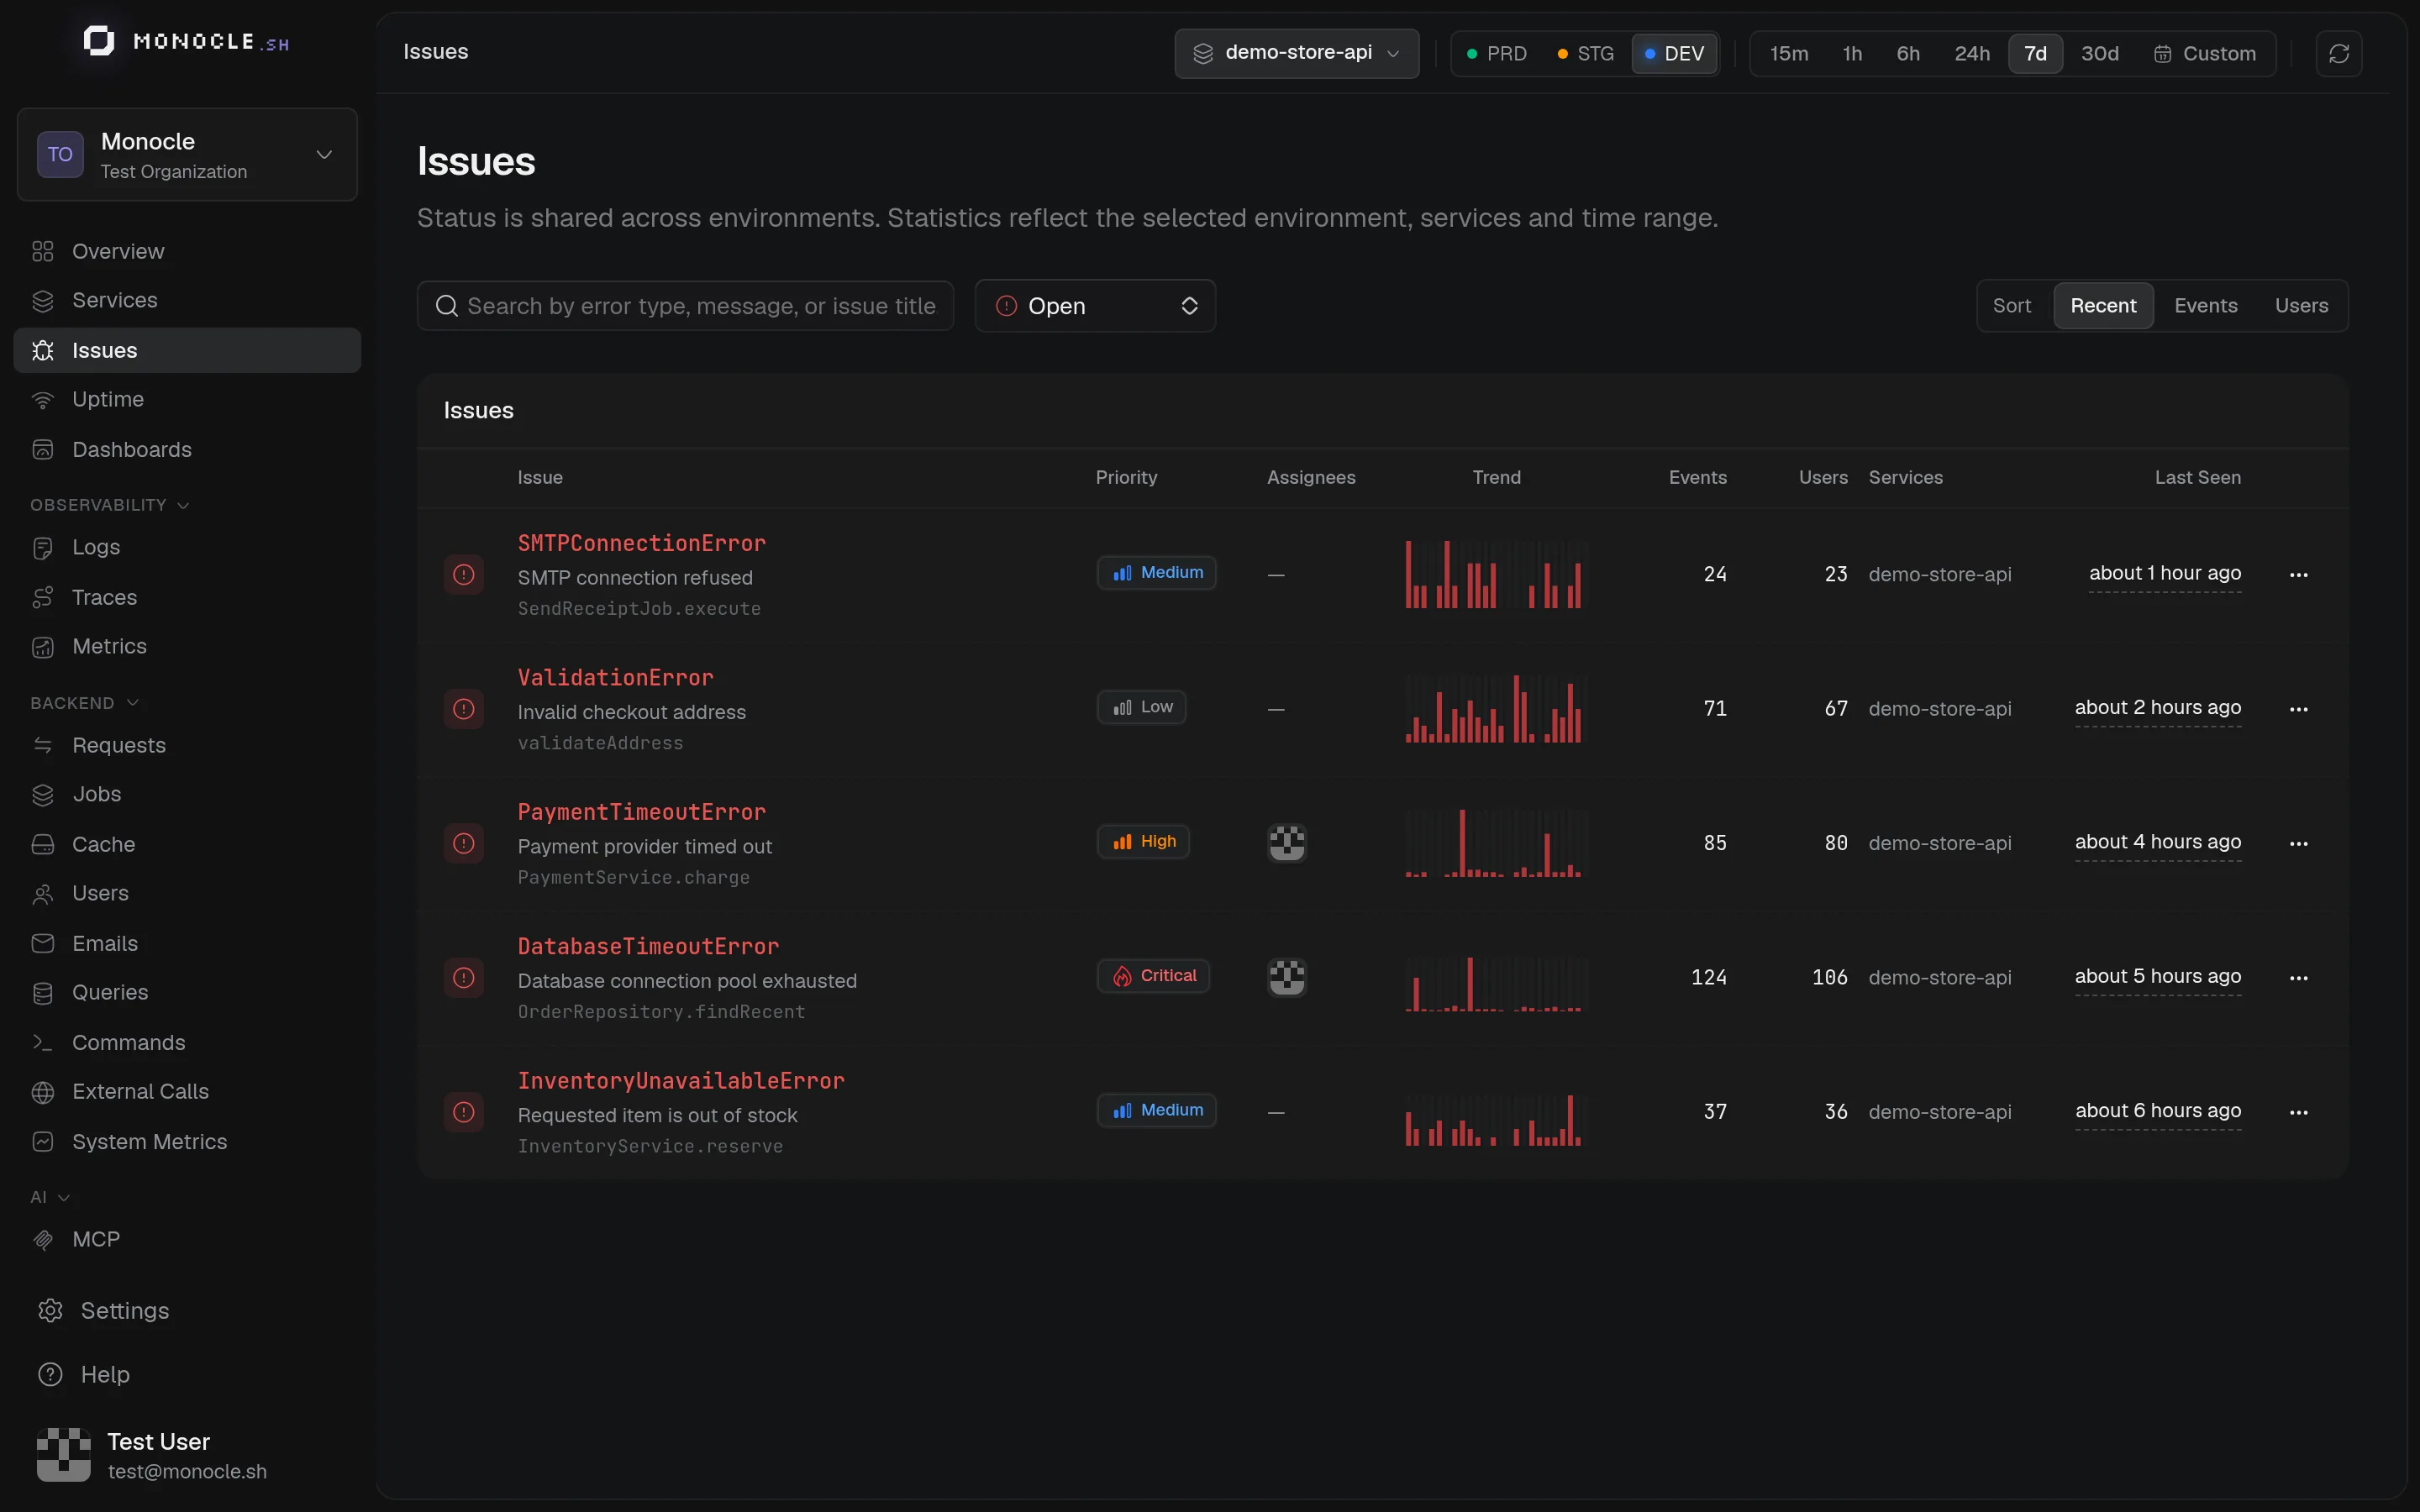
Each row shows the issue, its priority and assignees, a trend of its occurrences, the number of events and affected users, the services that reported it, and when it was last seen.
- Search by error type, message, or issue title.
- Filter by status: Open (default), Resolved, Archived, or all statuses.
- Sort by Recent, Events, or Users.
The Overview also lists open issues by reason: new, regressed, high priority, and unassigned.
Triage an issue
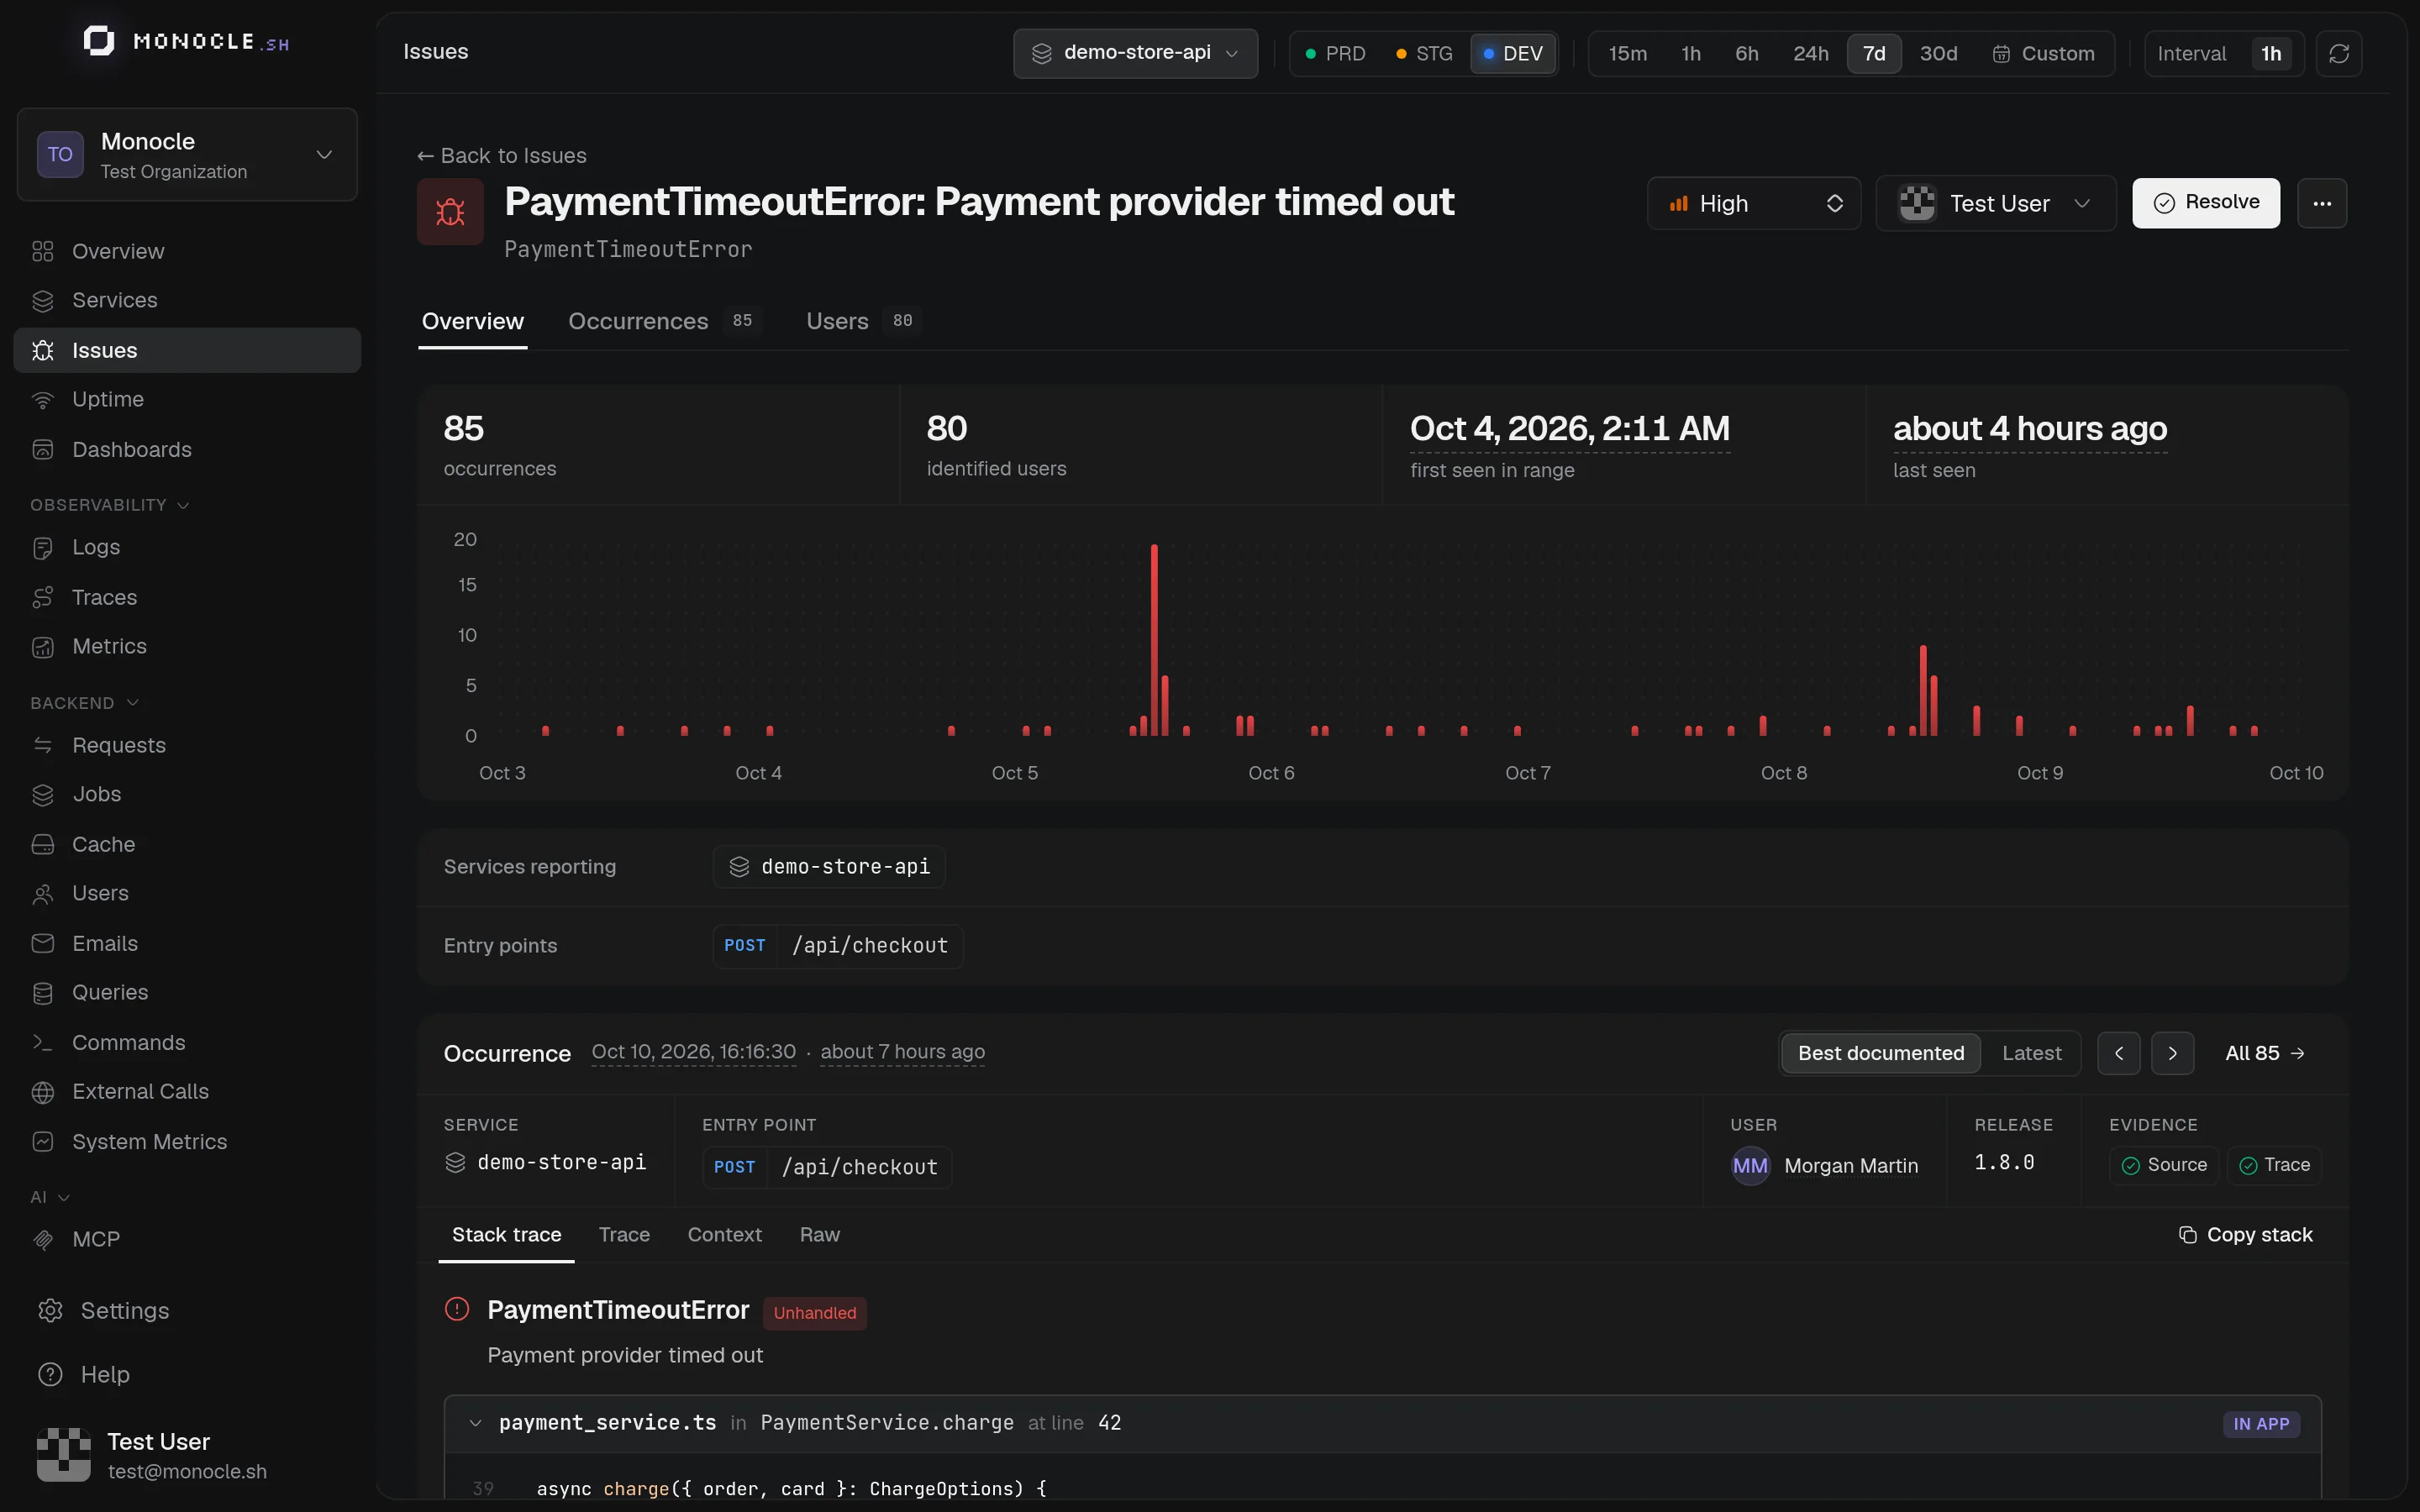
From the header of an issue:
- Priority: Low, Medium (default), High, or Critical
- Assignees: any member with access to the project
- Resolve once the fix is deployed, or Reopen
- Archive, from the menu, forever or for 1 hour, 1 day, 1 week, or 30 days, to silence an issue you don't plan to fix now
- External links, from the same menu: create or link a GitHub or Linear issue
The activity panel keeps the history of the issue (status, priority, and assignee changes, regressions) and lets your team discuss it in comments.
Lifecycle
| Event | What happens |
|---|---|
| A resolved issue gets a new occurrence | It is reopened and flagged as regressed |
| An issue appears in a new environment | It is flagged as first seen in that environment |
| An archive duration expires | The issue is reopened silently |
| An issue is archived forever | It never comes back and sends no notification |
| The linked GitHub or Linear issue is closed | The issue is resolved |
| No occurrence in any environment for 90 days | The issue is deleted, unless it is archived forever |
New and regressed issues are sent by email, and to Slack, Discord, or your own webhooks. See Exception rules.
Investigate an issue
The Overview tab shows the number of occurrences and identified users, when the issue was first and last seen, a chart of its occurrences, the services that reported it, and the entry points (endpoints, jobs, or commands) where it happened, with their service.
Below, the occurrence inspector opens the Best documented occurrence: the one with the most context, such as source code, a trace still available, and an identified user. Switch to Latest, or step through older and newer occurrences. Each occurrence has four tabs:
| Tab | Shows |
|---|---|
| Stack trace | Each frame with the surrounding source code, your own code marked In app, and the causes |
| Trace | The trace of the request, job, or command that failed |
| Context | The request, job, or command, the user, tags, and extra data |
| Raw | The exception as it was received |
Below the tabs, Other exceptions in this trace lists the exceptions that other spans of the same trace reported, in any service, with a link to their issue. The exceptions raised under the failing span come first. When a call to another service fails, the list shows the error that caused it in that service.
The context of an occurrence comes from the service that reported it. If the browser calls your API and the API fails, the occurrence shows the route and user of the API request, not those of the browser page.
The Occurrences tab lists every occurrence with its service, message, entry point, and user. The Users tab lists the identified users who hit the issue.
How exceptions are grouped
Monocle computes a fingerprint for each exception so that the same bug always lands in the same issue, even when its message contains IDs, dates, or emails.
- With a stack trace, the fingerprint uses the exception type and the top frames of your own code. Frames from
node_modulesand Node internals are ignored, so a library upgrade doesn't split your issues. - With a cause chain or an
AggregateError, the causes are part of the fingerprint. - Without a usable stack trace, Monocle falls back to the exception type and the message, with variable parts such as numbers, UUIDs, emails, URLs, and dates replaced by placeholders.
Where exceptions come from
- With the AdonisJS agent, errors reported by your exception handler are captured automatically. You can also capture errors and messages yourself, see Users & Exceptions.
- With the browser SDK, uncaught errors and unhandled promise rejections are captured by default.
- With any OpenTelemetry SDK, exceptions recorded on spans with
span.recordException()are picked up. See Semantic conventions.