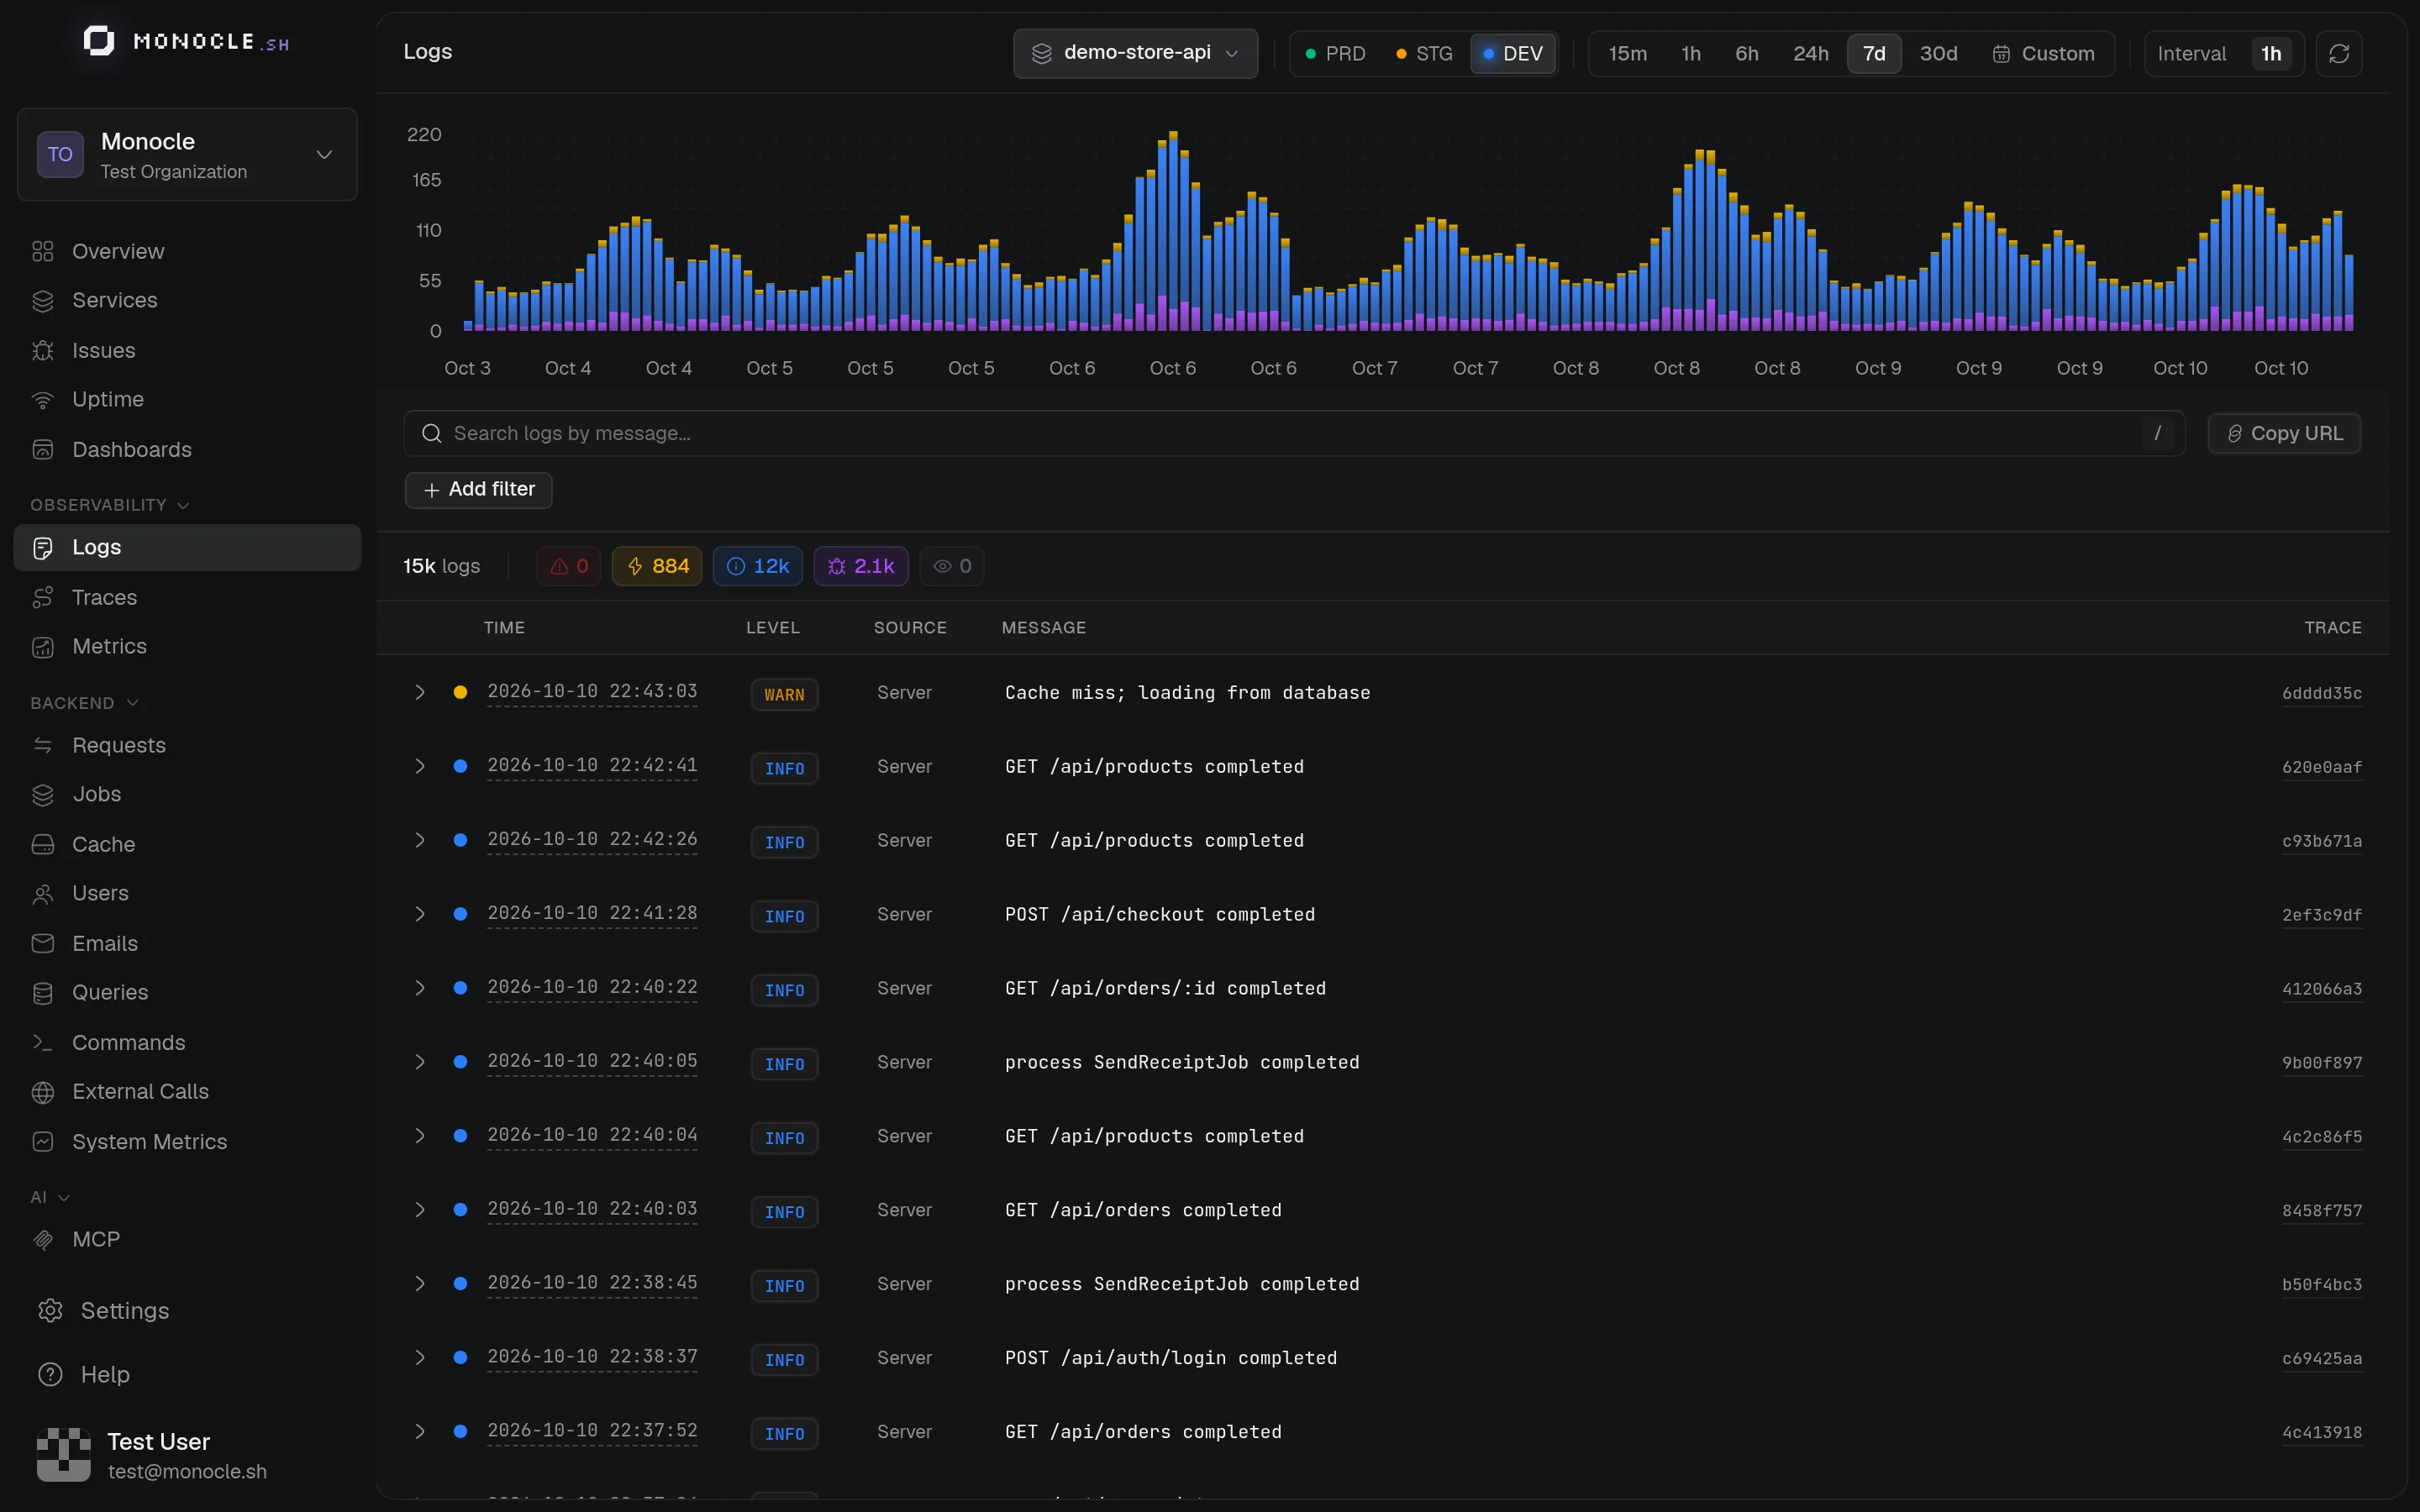
The Logs page collects the log lines of all your services. Each log keeps the ID of the trace and span that were active when it was written, so you can go from a log line to the full request in one click.
Find logs
The search bar at the top does both search and filtering:
- Type text and press
Enterto search log messages. - Type a field name (
level,service.name,trace.id, any log or resource attribute) to pick values from a list with their counts. Select several values for "is any of", pressTabto switch the operator (is, is not, contains, starts with,>,<…). - Or type a filter directly:
status>=500,path^/auth,service.name!=worker. - Press
/to focus the bar andBackspaceto remove the last filter. Copy link shares the current view.
Under it, All, Error, Warn, Info, and Debug filter on the level and show how many logs each one has. The chart shows log volume over time, with warnings and errors in color. Drag across it to zoom into a period.
The table lists the most recent logs first and loads more as you scroll. HTTP methods, paths, status codes, and durations in messages are highlighted. Columns adds any attribute as a column.
Inspect a log
Click a row to open it on the right. Drag the border to resize the panel, and use ↑ and ↓ to move between logs.
- Overview shows the message, service, trace, source, and every attribute. Hover a value to filter on it, exclude it, or copy it.
- Same trace lists the other logs of the trace in order, and Same service the logs written just before and after.
- JSON shows the raw log.
Press f to open the log full screen, with the overview and the JSON side by side.
What appears here
Any log record sent through OpenTelemetry shows up on this page. With the AdonisJS agent, logs written with the AdonisJS logger are sent automatically and linked to the current trace.
Exceptions are not listed here: they are grouped into Issues.
Send a severity text (INFO, WARN, ERROR…) with each log. Monocle uses it for levels, colors,
and counters.