A trace is the full story of one unit of work: an HTTP request, a background job, an Ace command. It is made of spans, one per operation, such as a database query, a cache lookup, or a call to another API. The Traces page lets you find any trace and open it as a waterfall.
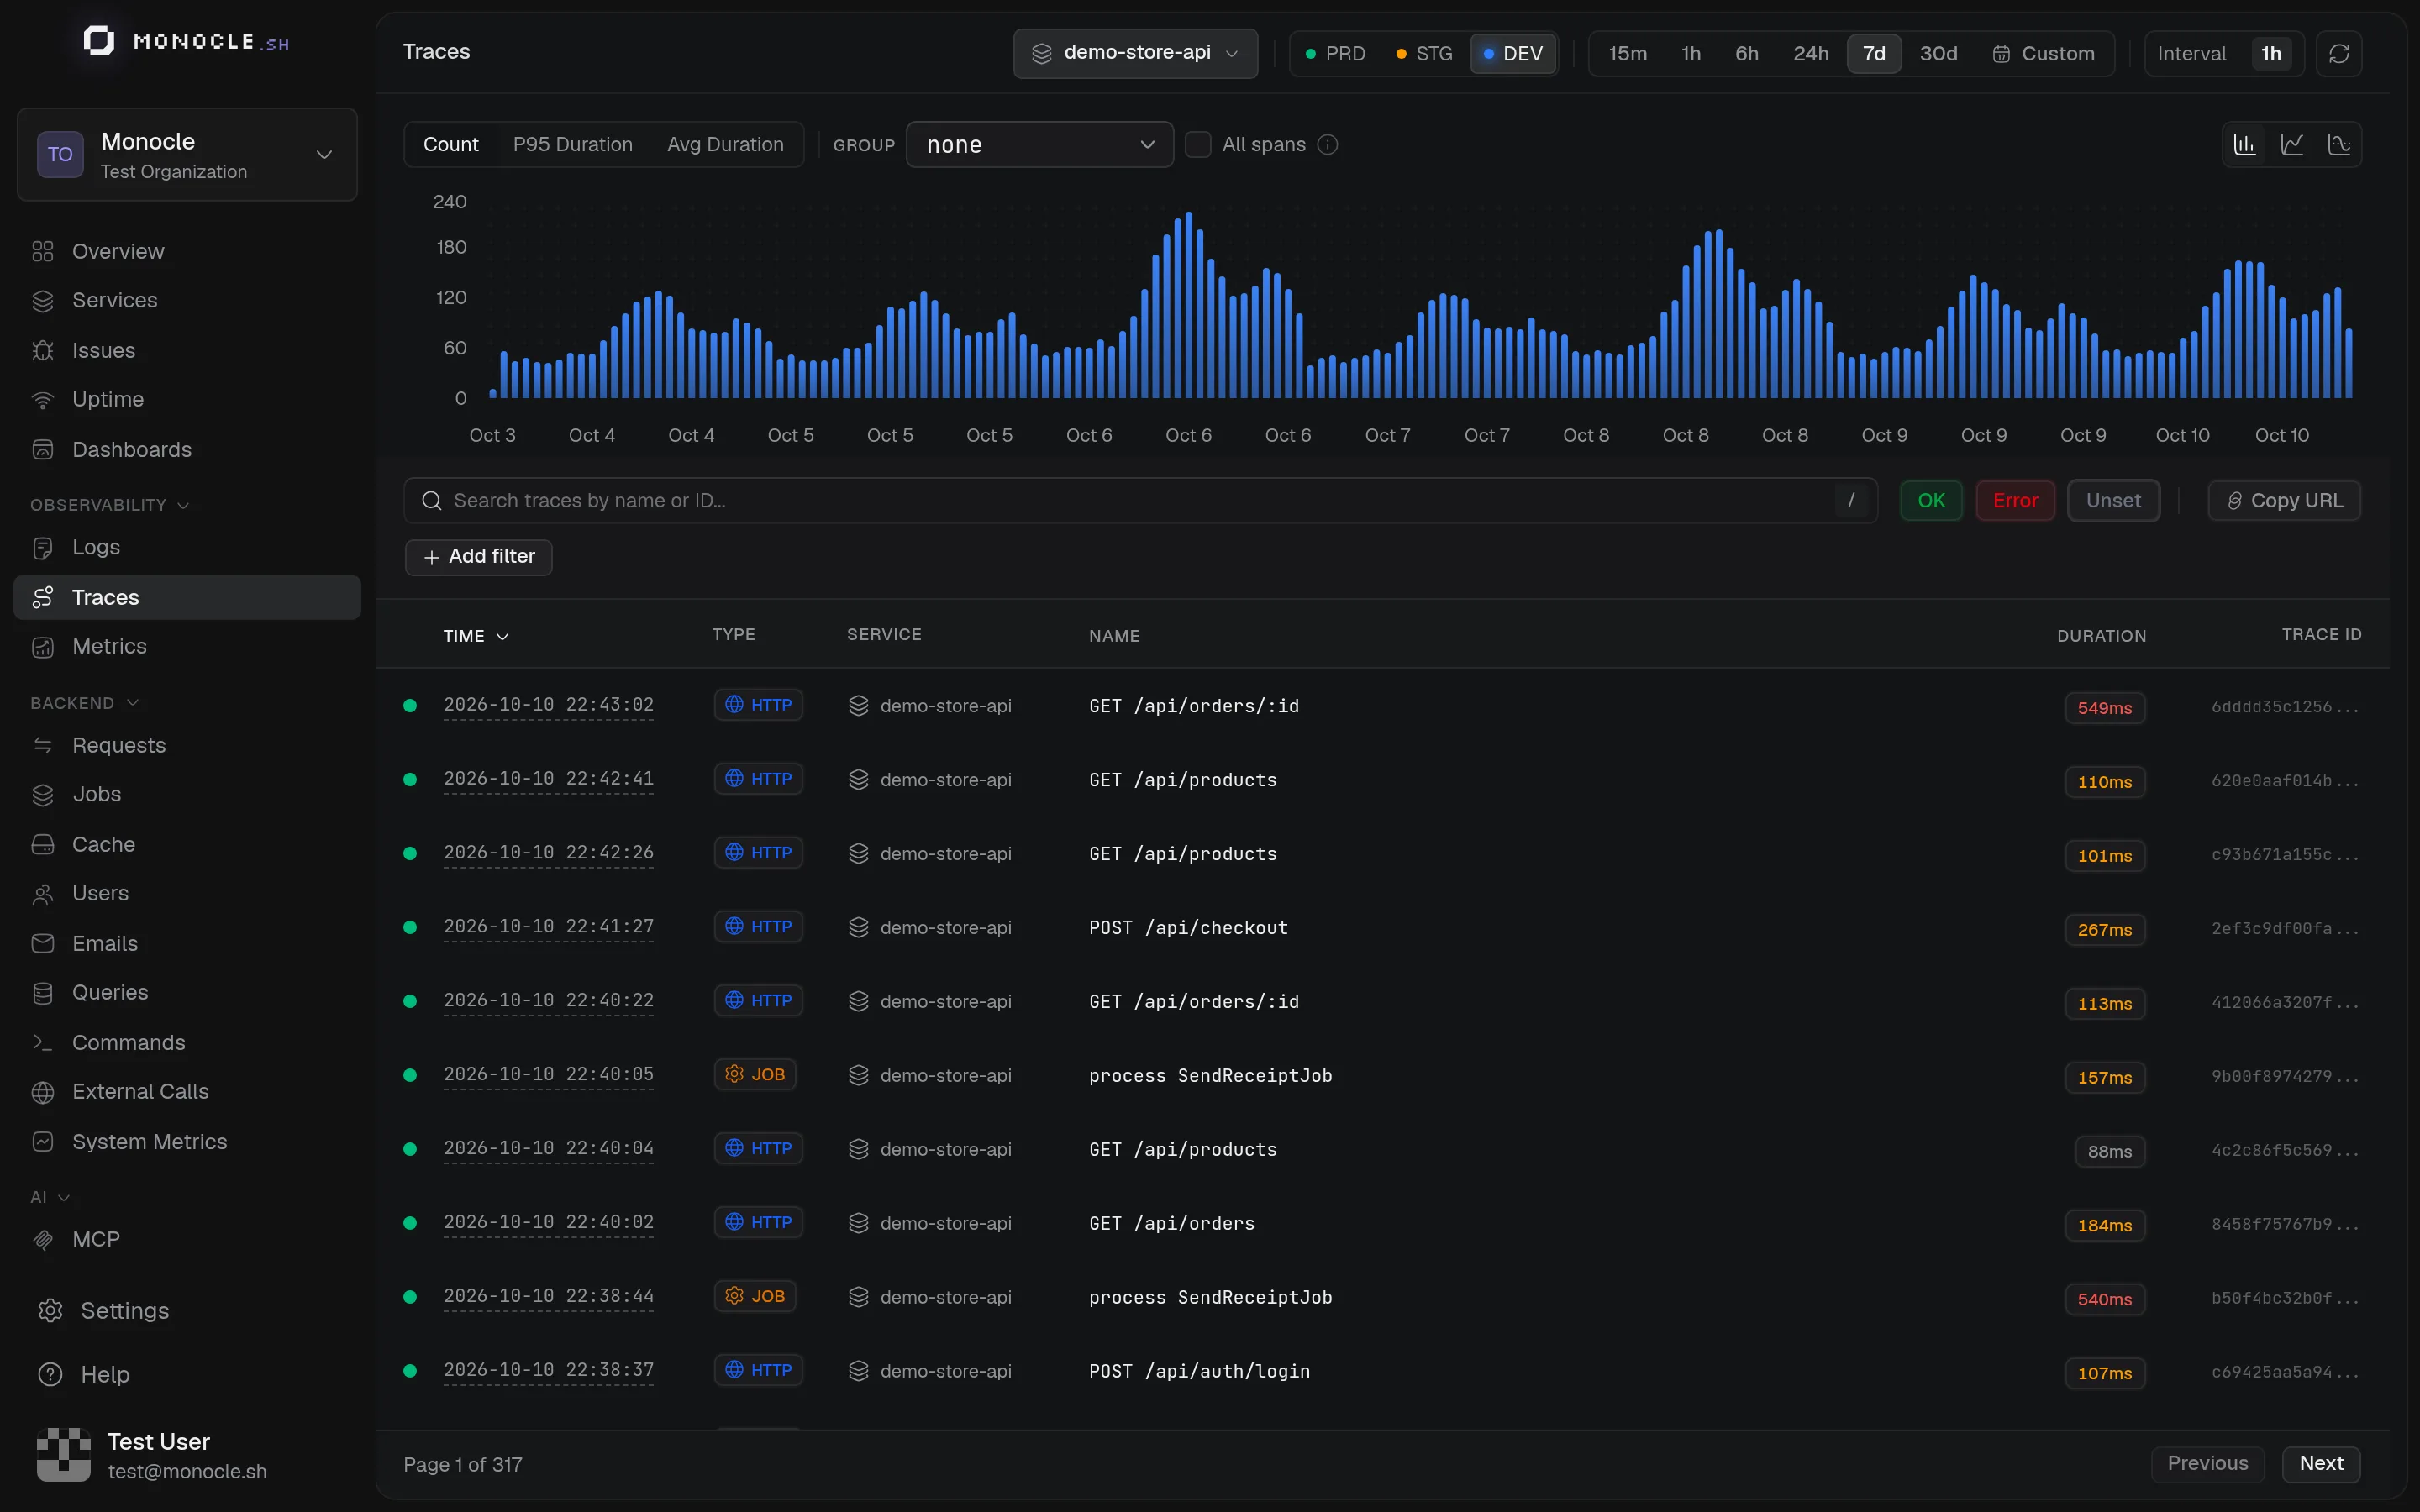
Find traces
The search bar at the top does both search and filtering:
- Type text to search span names, or paste a trace ID to jump to that trace.
- Type a field name (
status,service.name,duration,span.kind,http.route, any span or resource attribute) to pick values from a list with their counts. Select several values for "is any of", pressTabto switch the operator (is, is not, contains, starts with,>,<…). An attribute that only exists on child spans, such asdb.system, keeps the traces containing a matching span, and its counts are spans. - Or type a filter directly:
duration>=500ms,http.route^/api,service.name!=worker. Durations acceptµs,ms,s,mandh, a bare number is milliseconds. - Press
/to focus the bar andBackspaceto remove the last filter.
Below it, All, Error, Ok, and Unset filter on the status and show their counts. The chart shows the number of Segments over time, with failures on top. A segment is the part of a trace that runs in one service, so a request that goes through two services counts twice. Switch the chart to P95 or Avg duration, and use Group by to split it by any field. Drag across the chart to zoom into a period.
The table lists the entry point of each trace: HTTP requests with their method, route, status code, and duration, Job runs with their queue, and CLI commands. When a trace enters more than one service, its row lists those services. Scroll to load more, and click Time or Duration to sort. Columns adds attributes such as url.path as columns. Root spans of a backend service that are only a database query or an HTTP call are labeled bg, see Background spans. A fetch from a browser service is a normal entry point and shows as HTTP.
Click a row to preview the trace on the right: its waterfall, the attributes of the entry span, and its logs. Use ↑ and ↓ to move between traces, and f or Enter to open the full trace.
Read a trace
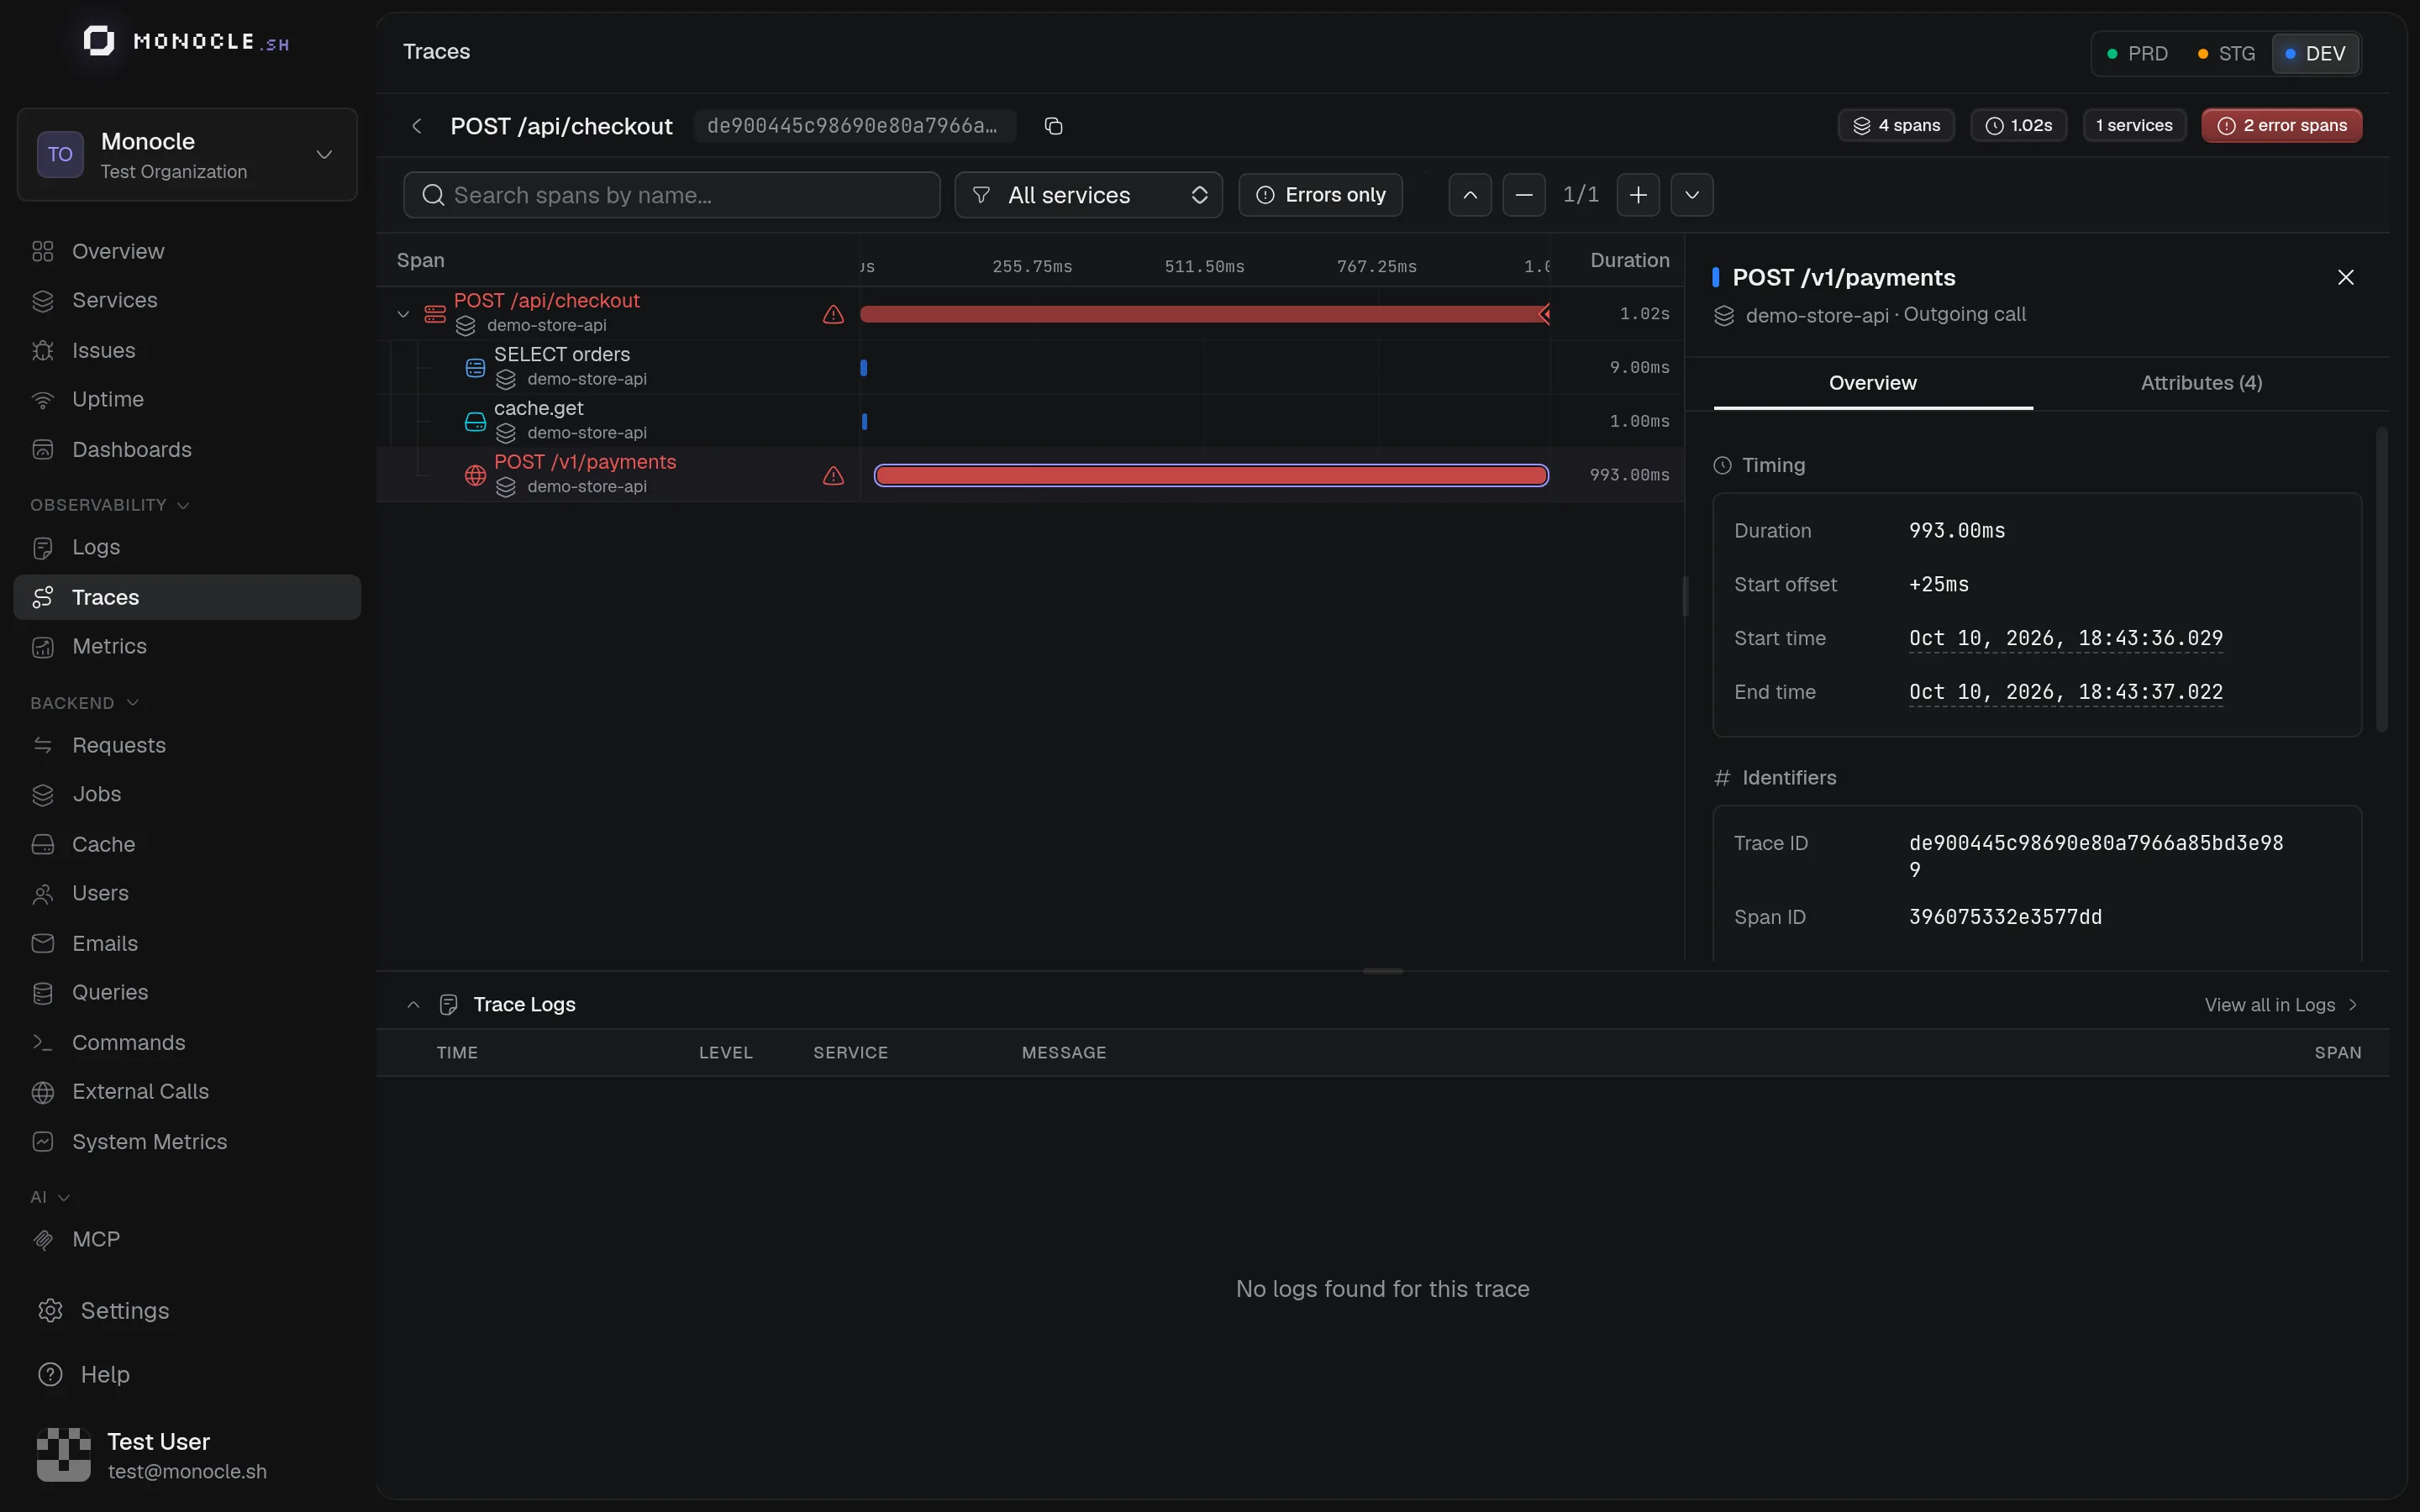
The header sums up the trace: its entry point, total duration, number of spans, services, errors, and logs. Copy the trace ID, open its logs, or copy a link to the page from the top right.
The waterfall shows every span on a shared time axis. Child spans are nested under their parent, failed spans are red, and dots under a bar mark the logs written during that span.
- Find a span (
/) highlights the spans that match and keeps their parents visible. - Pick a service to focus on it, or Errors only to keep the failed spans.
- Use
↑and↓to move between spans,←and→to collapse and expand.
Click a span to open its details on the right. Drag the border to resize the panel. The Overview tab of a span called by another service also shows Called by, with the caller's service, and Network, the time spent between the two services.
| Tab | Shows |
|---|---|
| Overview | The highlighted SQL query for database spans, every attribute, and the span, parent, and trace IDs |
| Exception | The exception, its cause chain, tags, and extra data |
| HTTP body | Captured request and response bodies, when body capture is enabled |
| AI | Model, token usage, prompt, response, and tool calls of LLM calls |
| Events | Span events with their attributes |
| Logs | The logs written during the span, or during the whole trace |
| JSON | The raw span |
Tabs only appear when the span has the matching data.
Traces across services
When a service calls another one, the trace continues in the second service. The waterfall keeps both sides of the call. The caller's outgoing span comes first, and the work of the called service is nested under it, with a badge naming that service. Thin grey bars around the nested part show the time spent before the called service started and after it finished, such as network and proxies. For a job, they show the time the message waited in the queue, and the span panel shows Sent by and Queue wait.
Inside one service, an outgoing call and the request it received stay merged in one row.
Clock skew
Each service records its spans with the clock of its own machine. When two clocks disagree, a called service can look like it started before the call that started it. Monocle corrects this in the waterfall:
- If a called service starts before the call, Monocle moves it into the call. It does the same when the called service ends after the call and the caller got a response, even with an error status. A called service shorter than the call is centered in it. A longer one starts with it.
- Monocle moves a job, or a request that has no outgoing call as parent, only so that it doesn't start before its parent.
- Monocle ignores differences of 1 ms or less.
- Durations never change. Logs and events move with their span.
A shifted service shows a clock icon on its badge. The span panel says by how much the span was shifted and why, and marks the Network time as estimated. The Recorded start field keeps the original timestamp. The duration in the header uses the corrected times, so it can differ from the duration of the root span.
Connect services in one trace
A trace continues in another service only when the caller sends its trace context, in the W3C traceparent header. The Monocle agents and the OpenTelemetry instrumentations for HTTP clients send it by default. For calls they don't instrument, such as a custom transport, see context propagation. To connect the browser to your API, see Connect frontend and backend traces.
Without the trace context, each service starts its own trace. The calls still appear on both sides, but not in the same waterfall.
Where the data comes from
Traces are built from the spans your SDK sends. Monocle reads standard OpenTelemetry attributes to label them: the HTTP method and route for requests, the job name for jobs, the command name for CLI commands. See Semantic conventions for the full list.
To trace your own code, see Custom tracing.