The Queries page shows every database query run by your services, grouped by query pattern.
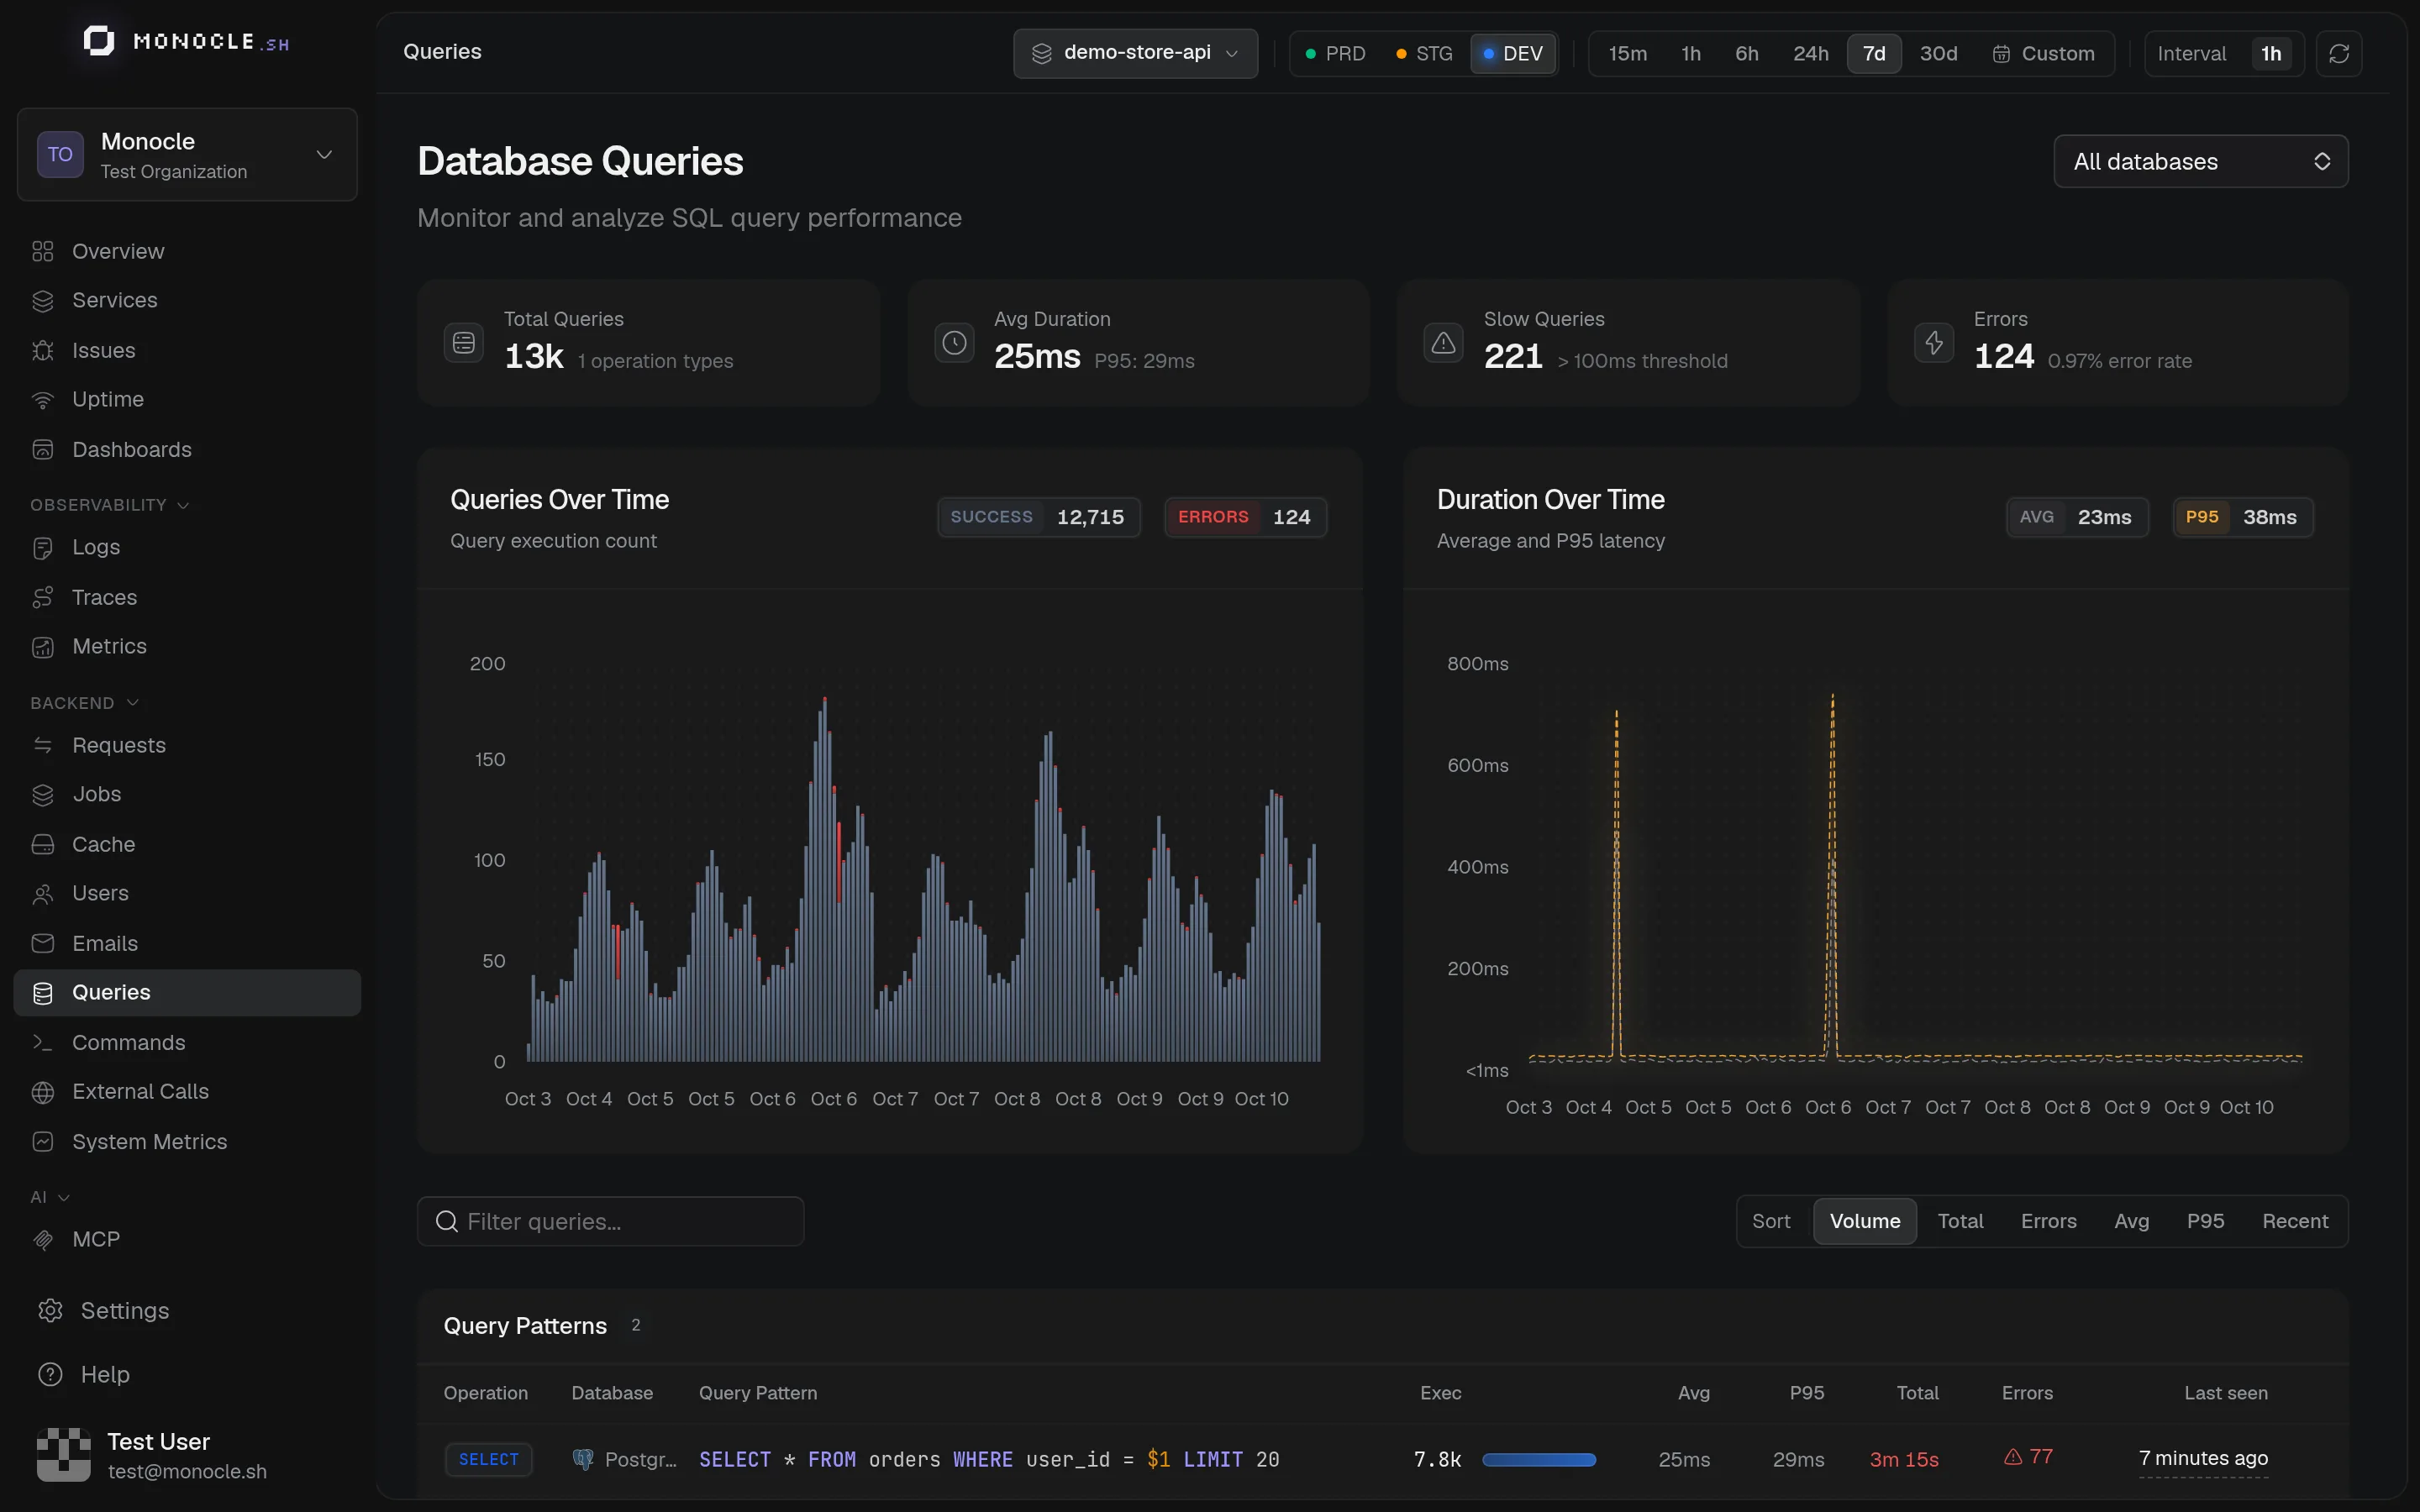
Overview
- Total Queries, Avg Duration with the P95, Slow Queries (above 100 ms), and Errors
- Queries Over Time, split between successful and failed queries
- Duration Over Time, average and P95
Use the database selector at the top right to keep only one database system, such as PostgreSQL or MySQL.
Query patterns
Queries that share the same SQL and run in the same service are grouped into a pattern. The same query run by two services makes two patterns, told apart by the Service column. The column is hidden when exactly one service is selected. The table shows the operation, database, query, number of executions, average and P95 duration, total time spent, and errors. Sort by Total to find the queries that cost the most overall, or by P95 to find the slowest ones.
Grouping relies on parameterized queries, where values are sent separately from the SQL (WHERE id = $1). ORMs and query builders such as Lucid, Kysely, and Drizzle do this by default. Monocle
also replaces UUIDs, long hexadecimal IDs, and IP addresses in the SQL with ?.
Query details
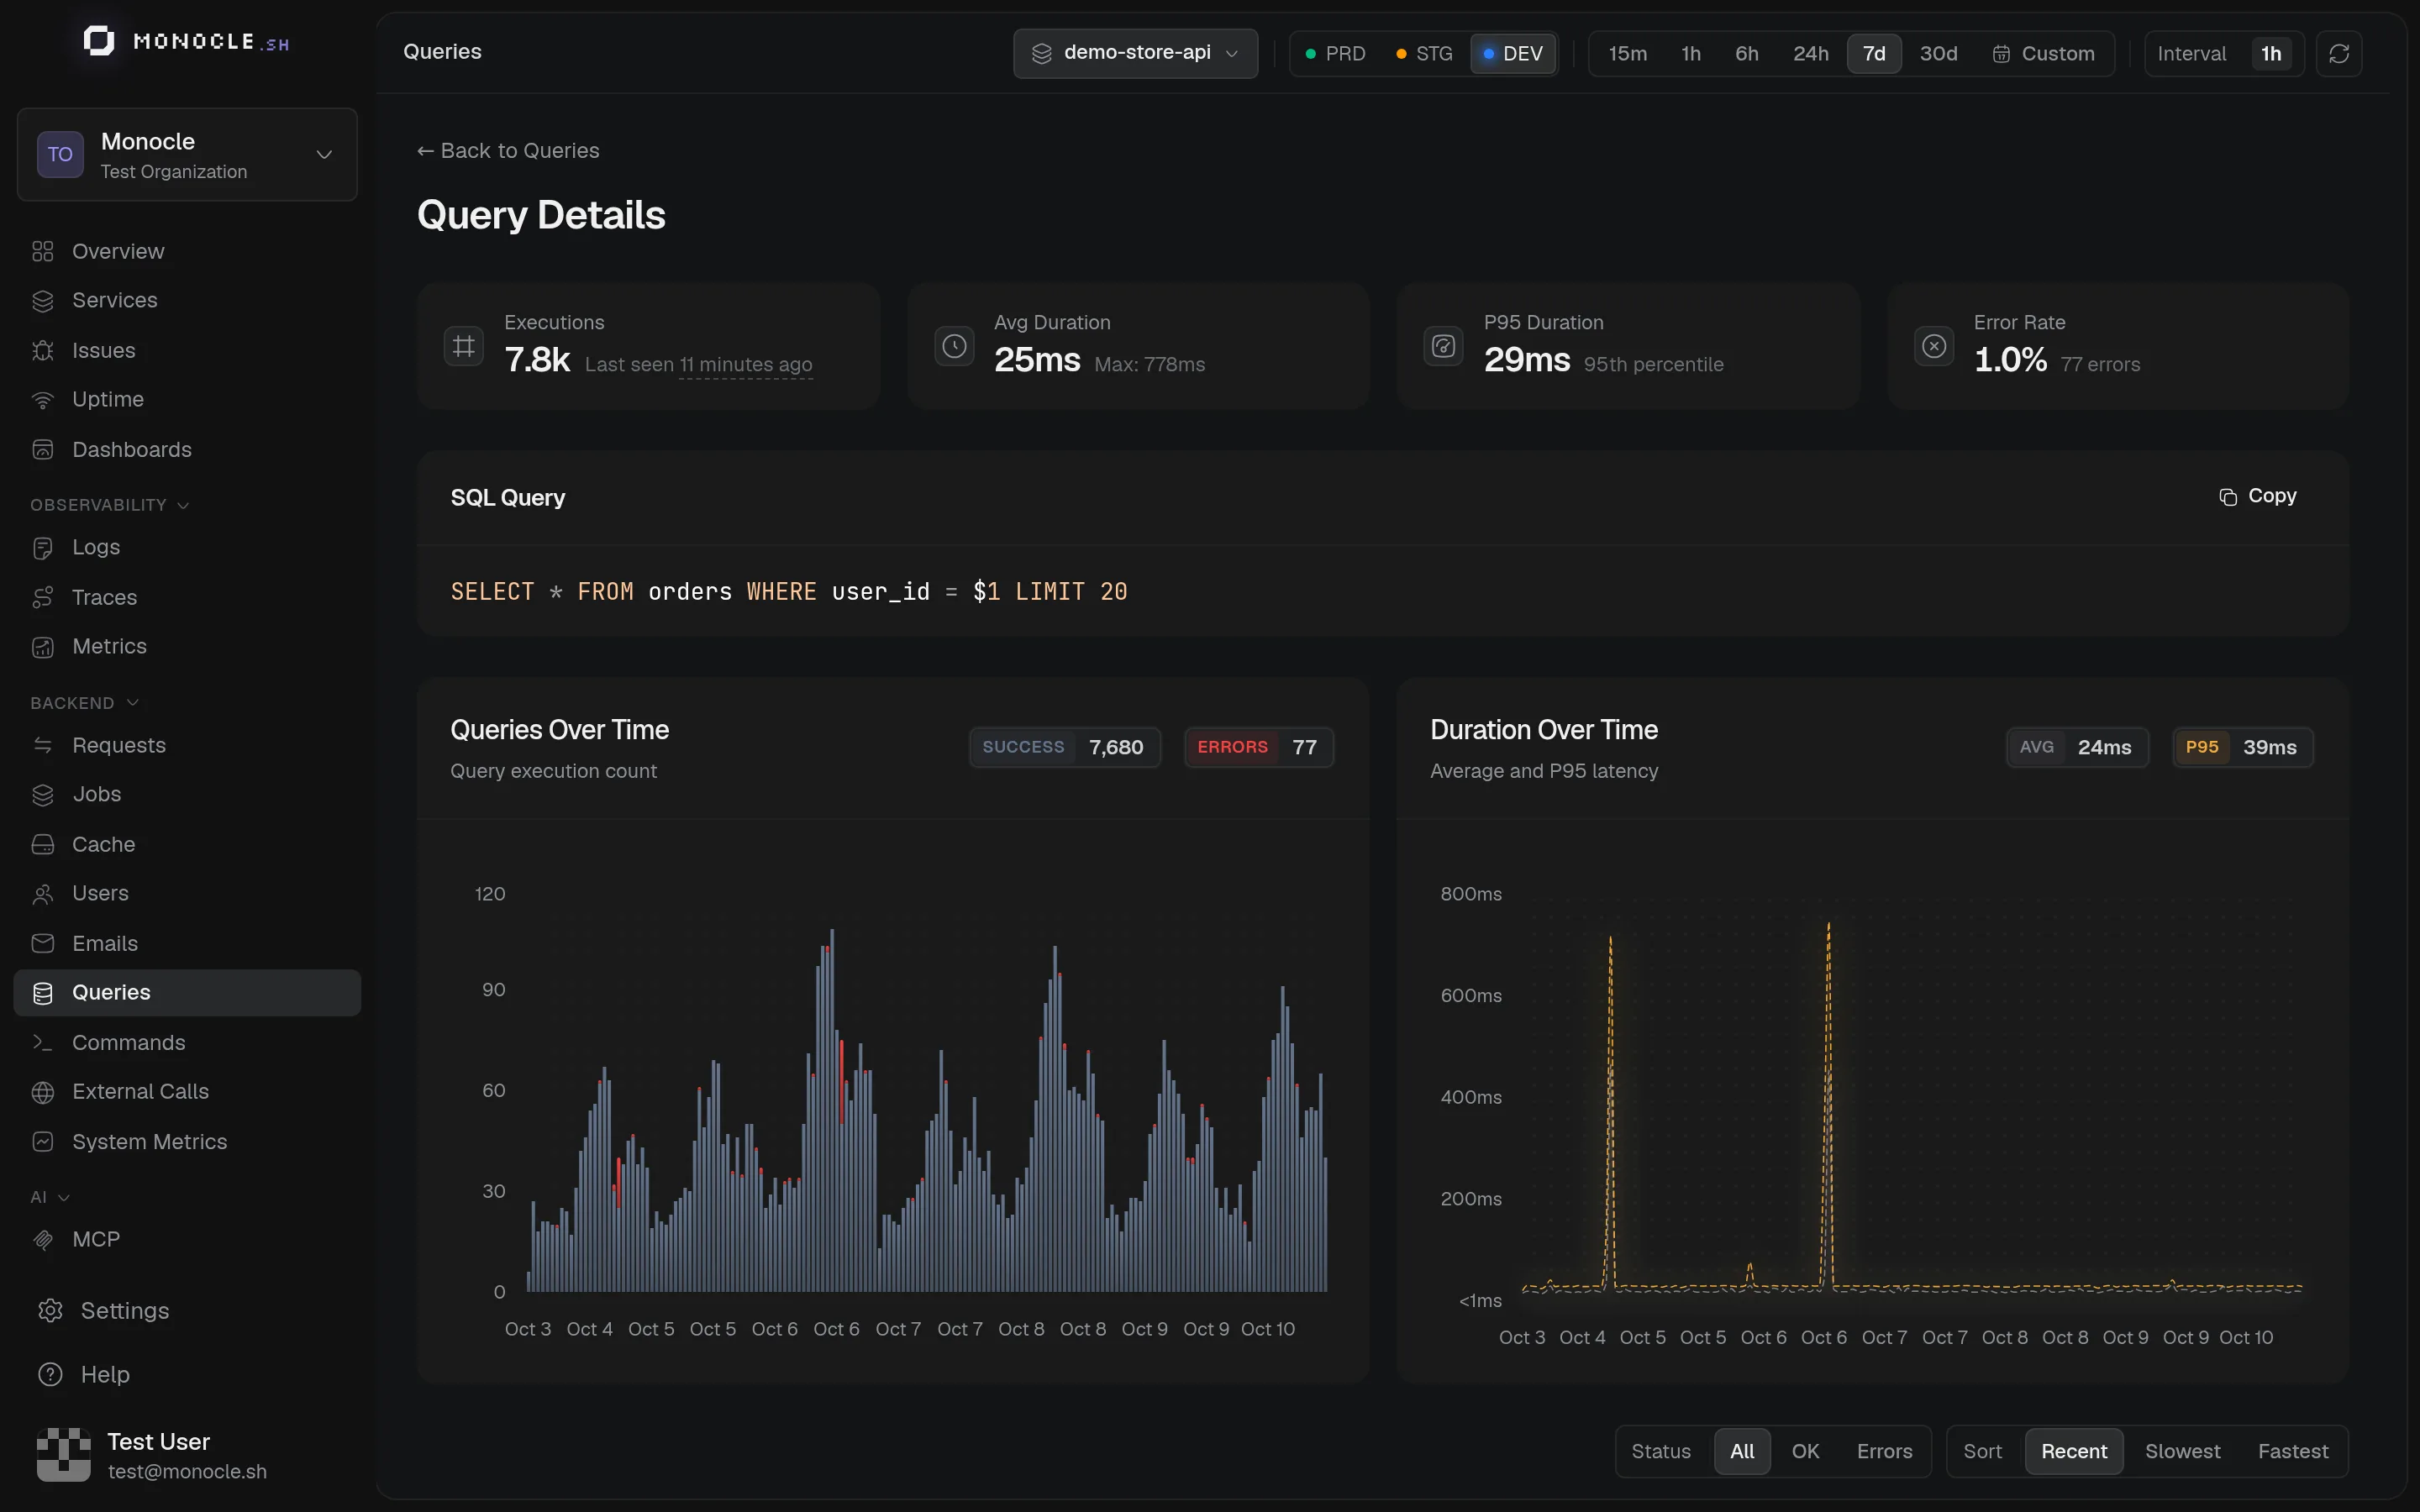
Click a pattern to see its service, the full SQL, its stats and charts, and Recent Executions. Each execution shows its duration, status, and where it was called from (the endpoint or job of the same trace), and opens its trace in one click.
What is counted
A query is a client span with a db.system.name attribute. The SQL comes from db.query.text. Older instrumentations that send db.system and db.statement work too: Monocle renames them on ingestion. Redis commands are not listed on this page.
See Semantic conventions, and the Kysely and Drizzle instrumentations.