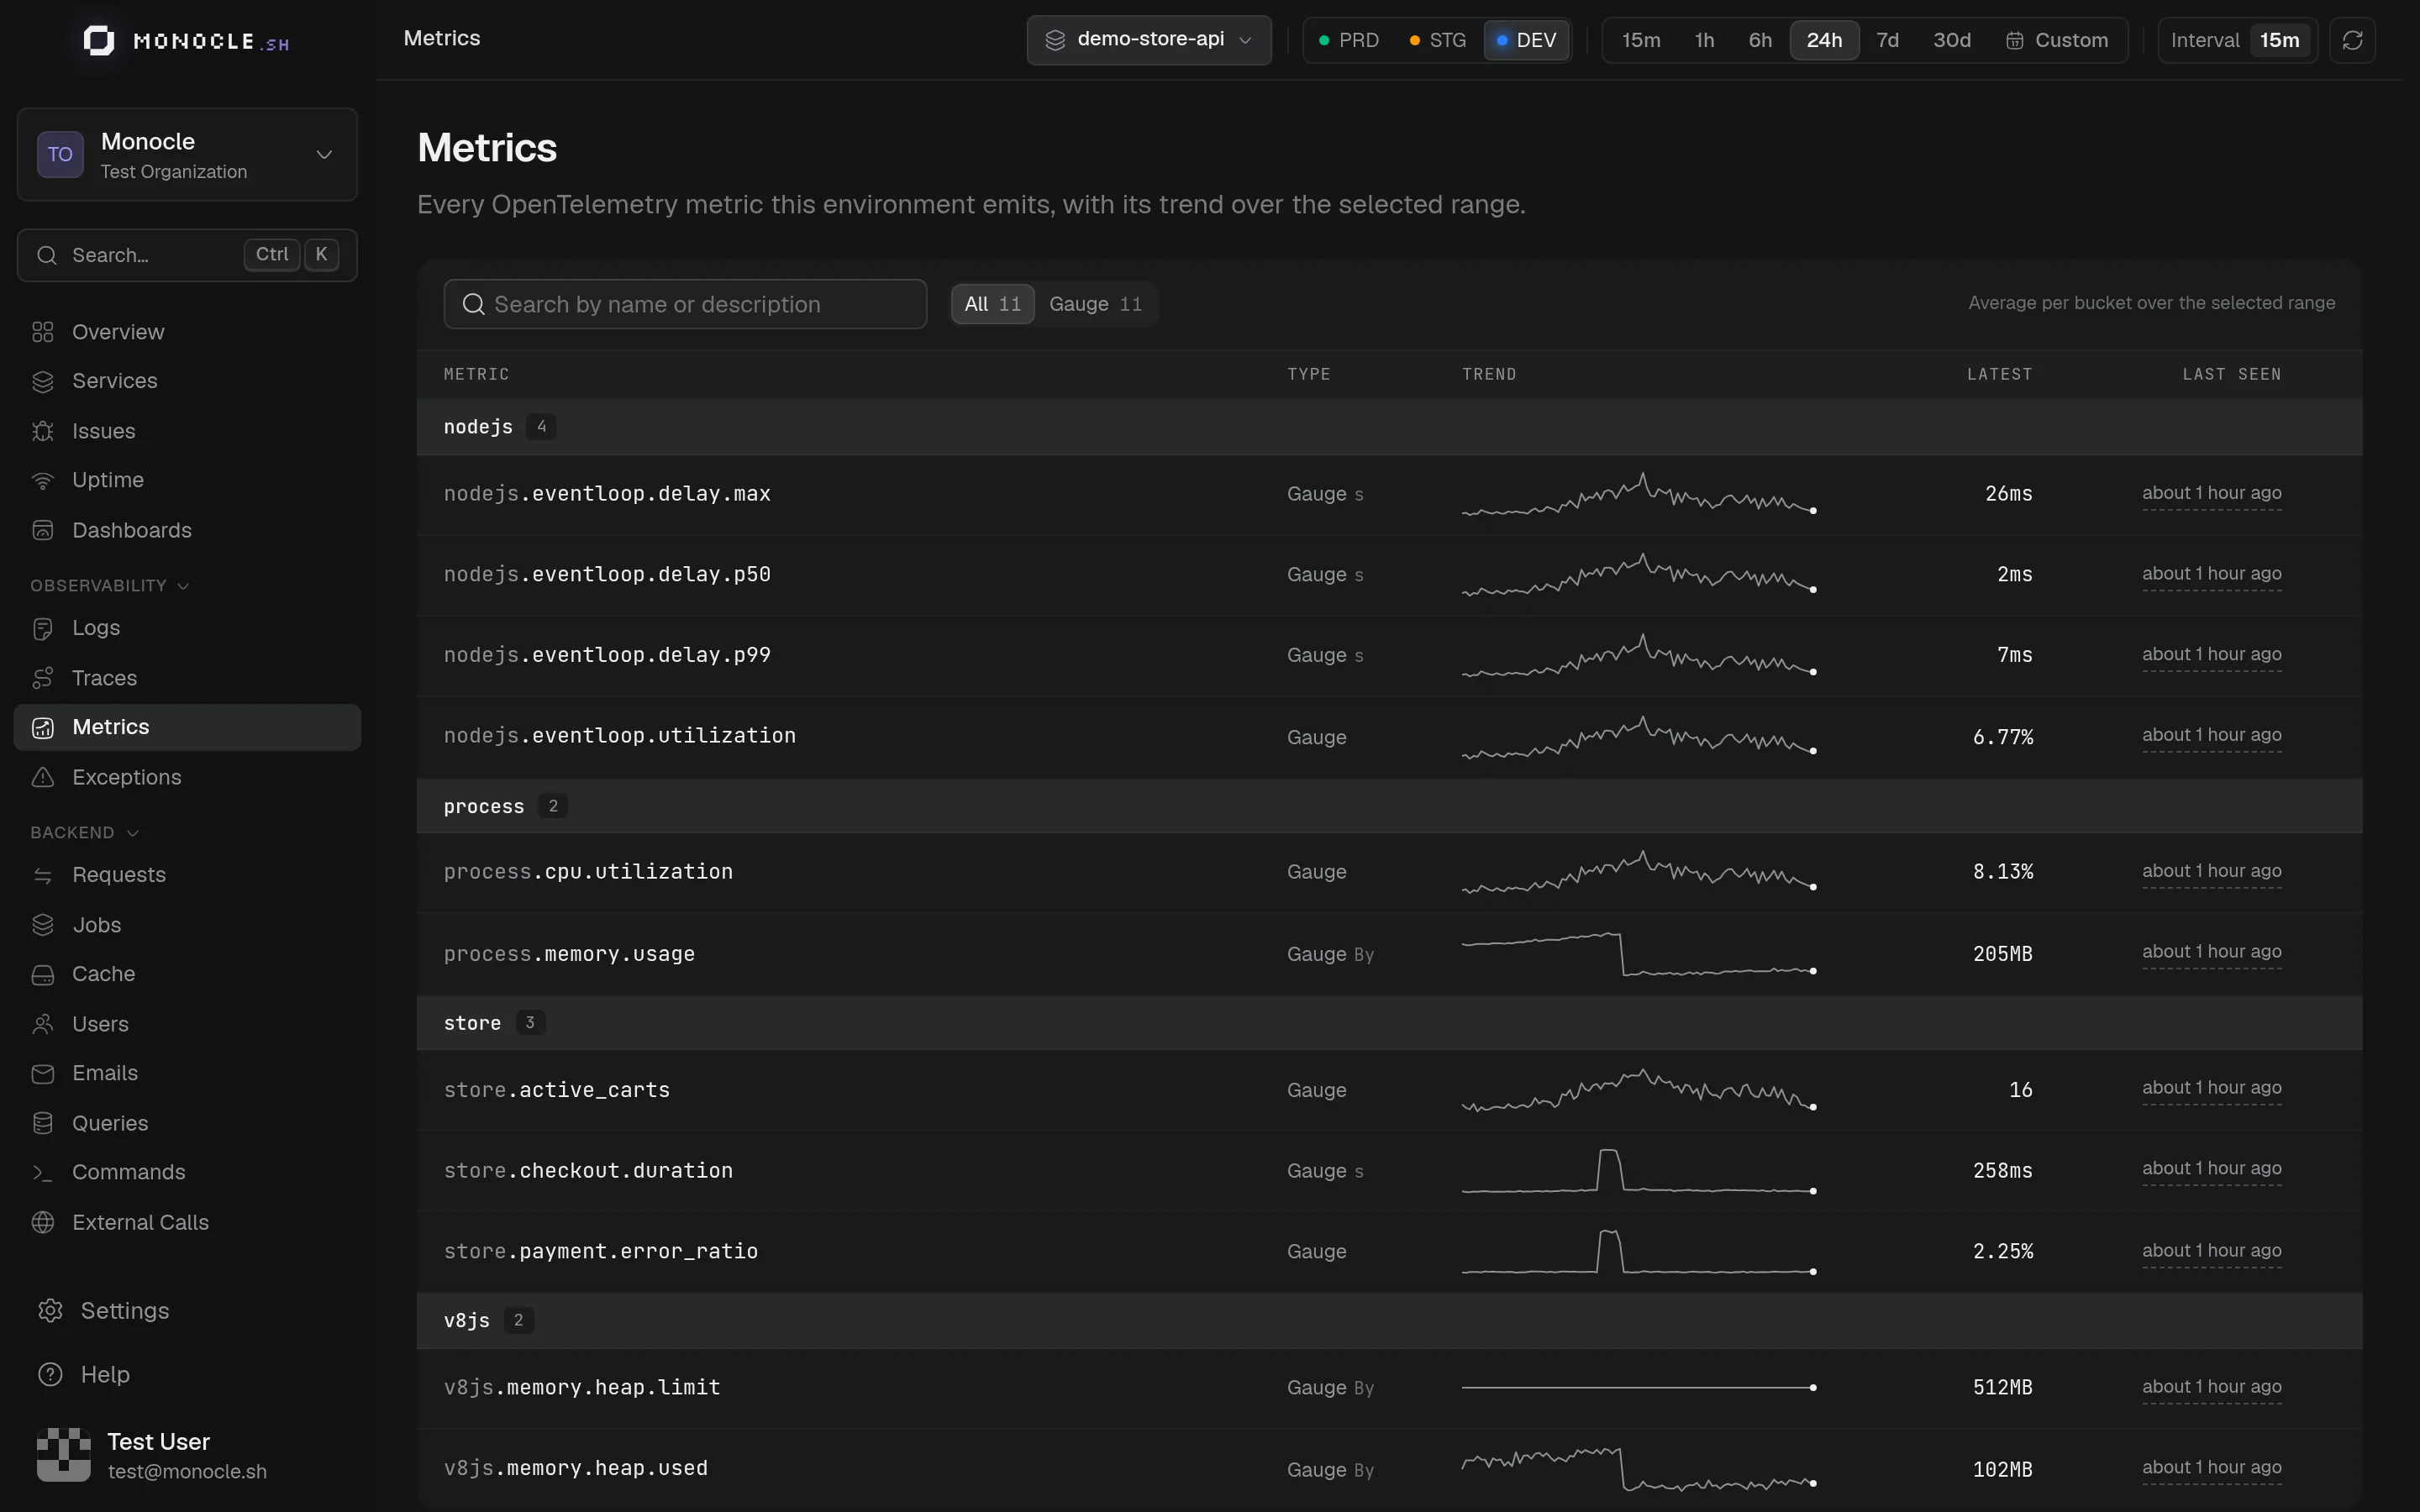
The Metrics page lists every OpenTelemetry metric received by the environment: runtime metrics from the agent, metrics from libraries, and the custom metrics you record yourself.
The list
Metrics are grouped by namespace, the part of the name before the first dot (nodejs, process, store…). Each row shows the name, the description, the type and unit, a trend over the selected time range, the latest value, and when the metric was last received.
Search by name or description, and filter on a type: Gauge, Sum, Histogram, or Summary. The search and the type are kept in the URL. The list includes every metric seen in the last 90 days.
Explore a metric
Click a row to chart the metric over the selected time range.
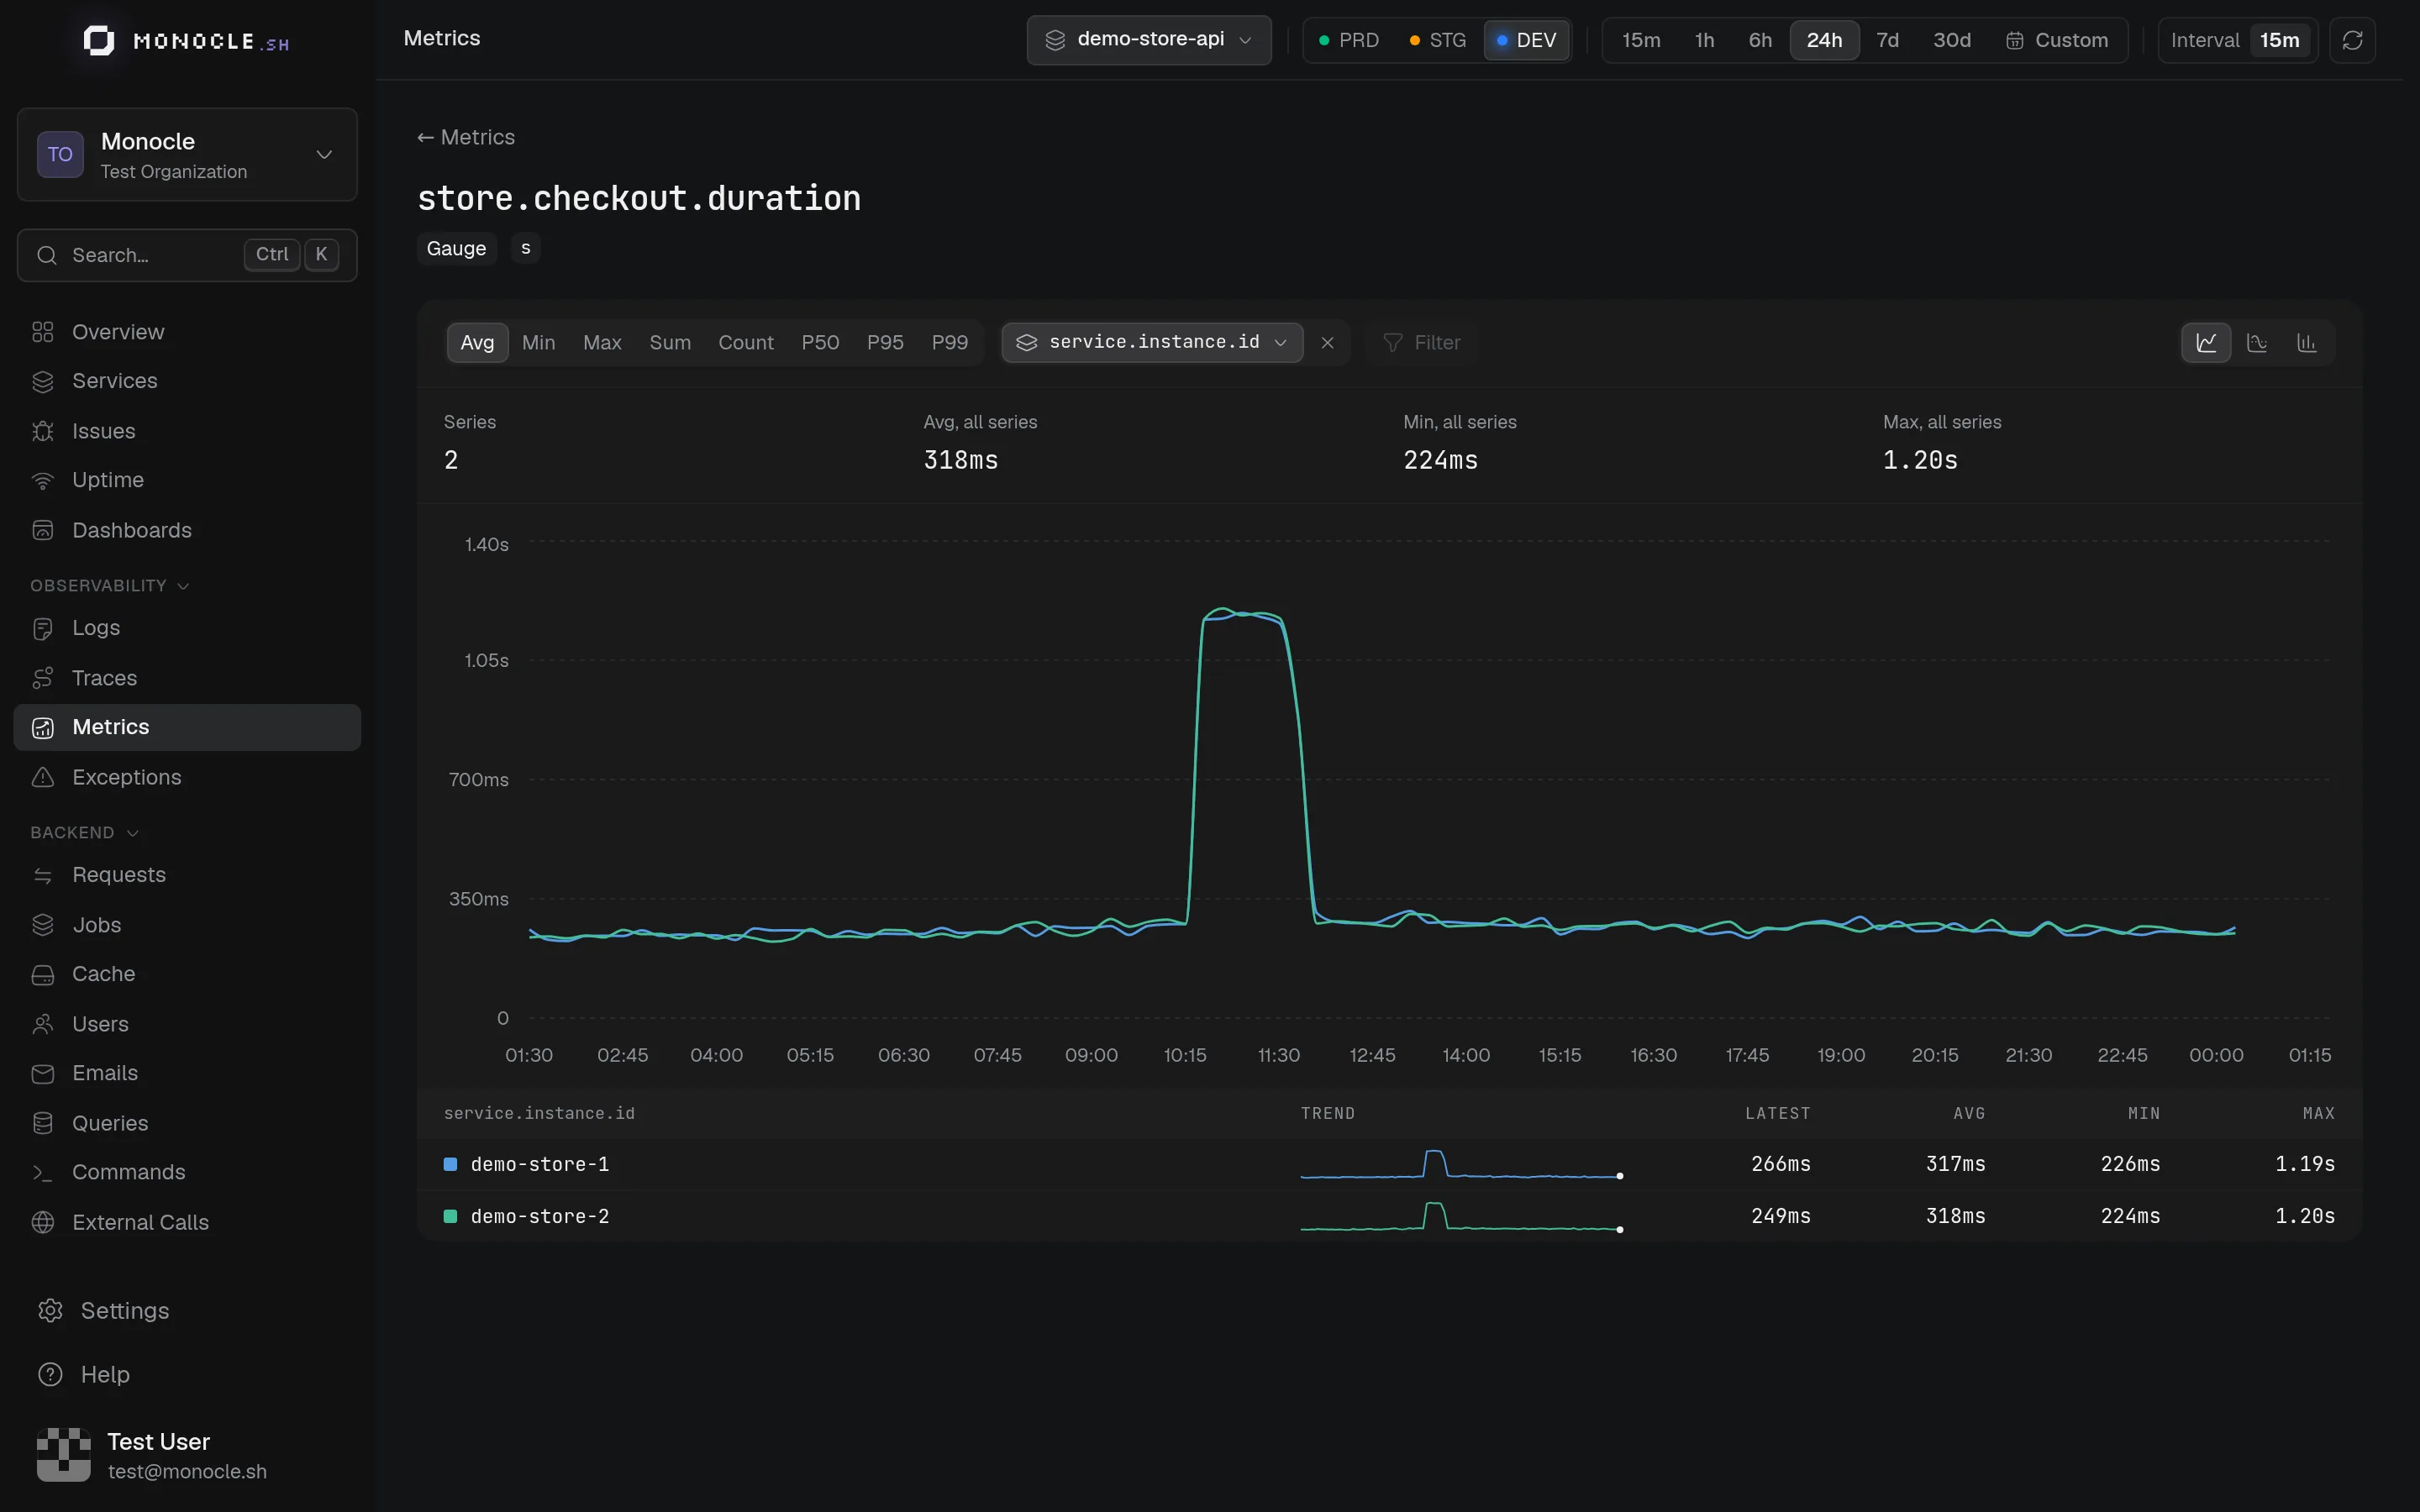
- Aggregation: the choices depend on the type. Counters (Sum) offer Sum, Rate, Average, Min, Max, and Count; histograms add the percentiles P50, P90, P95, and P99.
- Group by: split the chart by an attribute of the data points or of the resource, such as
service.instance.idorhost.name. The chart shows the 10 largest series. - Filter: keep only the data points whose attribute has a value. Pick the attribute, then one of its values or type your own. Click the
=of a filter to switch it to≠. - Chart type: line, area, or bars.
Under the toolbar, Latest, Avg, Min, and Max summarize the range. Drag across the chart to zoom into a period.
When the chart is grouped, a table lists each series with its trend, latest, average, minimum, and maximum. Click a series to hide it, double click to show only that one.
The aggregation, grouping, filters, and chart type are kept in the URL, so you can share the view. To combine several metrics or keep a chart at hand, add it to a custom dashboard.
Units and gaps
Monocle formats values from the metric unit: ms and s as durations, By as bytes, and 1 as a percentage when the name reads as a ratio (utilization, ratio…). Set the unit when you create a metric to get readable charts.
A gauge or histogram with no data point in a time bucket leaves a gap in the chart rather than a drop to zero. A counter (Sum) shows zero, since nothing was counted.
When two services report the same metric with a different type or unit, the metric can't be charted for both at once. Select one of the services in the service filter.
Record your own metrics
Use the OpenTelemetry metrics API from any service instrumented by Monocle:
import { metrics } from '@opentelemetry/api'

const meter = metrics.getMeter('store')
const checkoutDuration = meter.createHistogram('store.checkout.duration', { unit: 's' })

checkoutDuration.record(0.42, { 'payment.provider': 'stripe' })
Built-in runtime metrics (CPU, memory, heap, event loop) have their own System Metrics page.