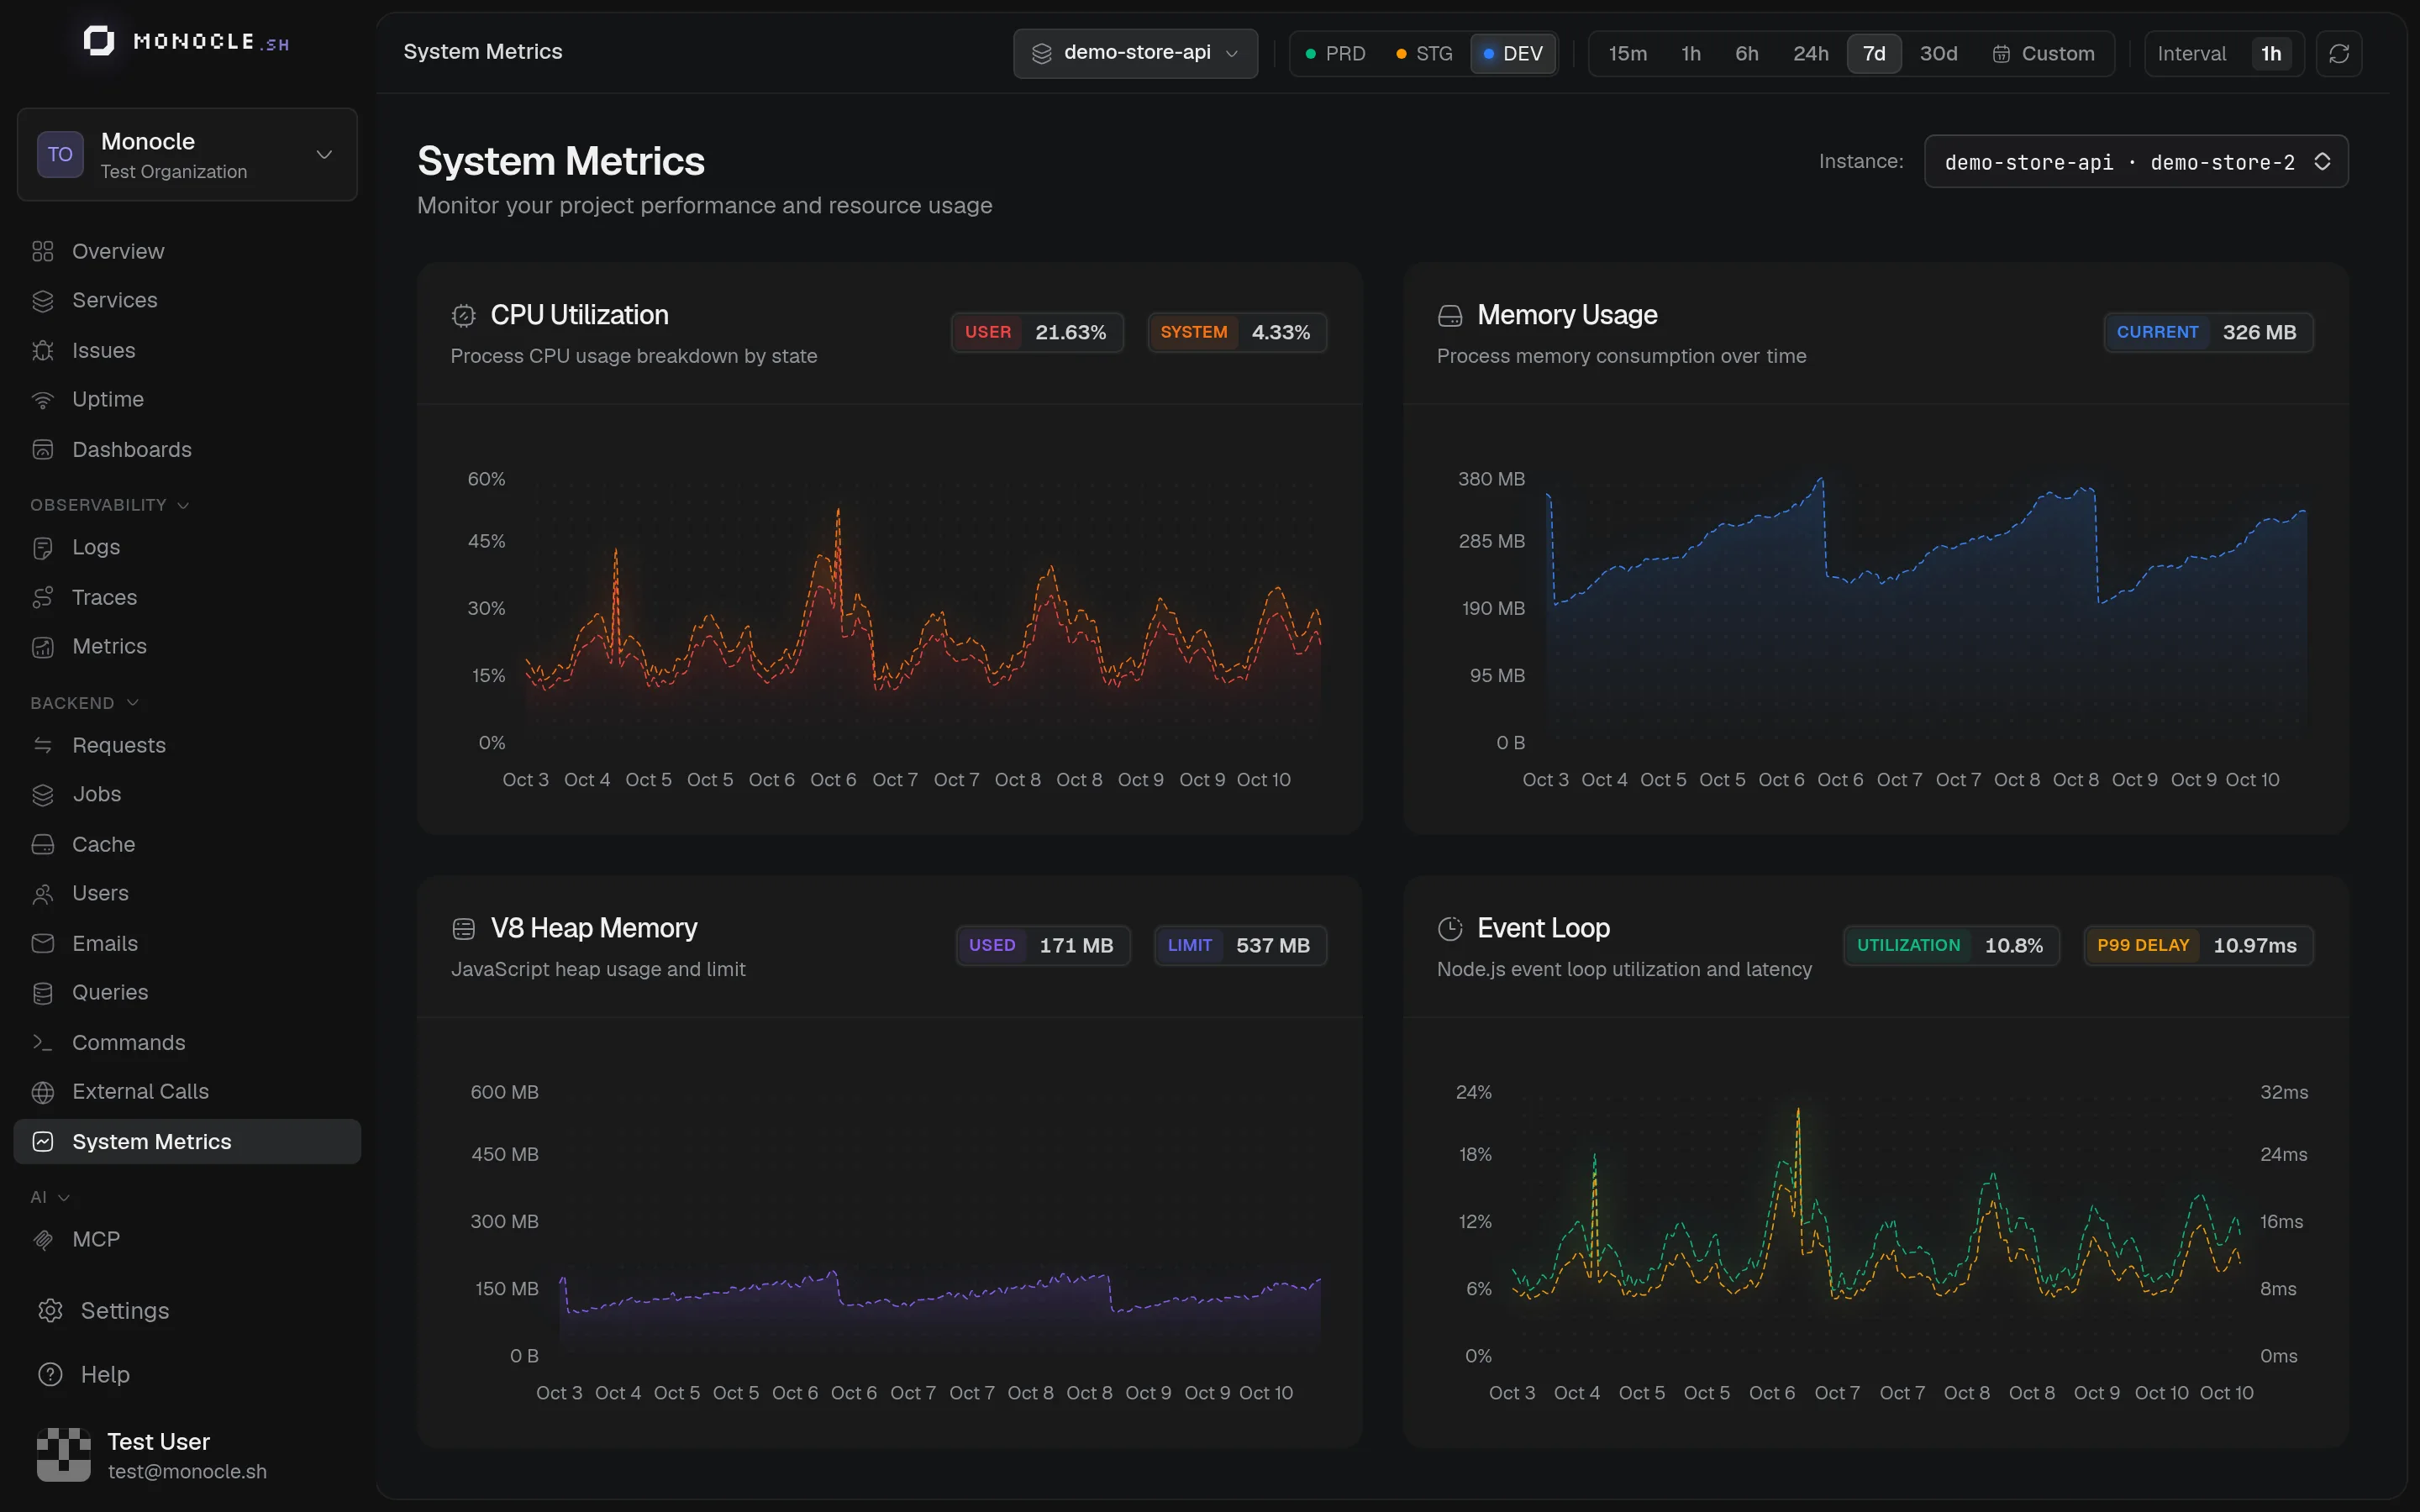
The System Metrics page shows how much CPU and memory each instance of your services uses, and how healthy the Node.js runtime is.
What you see
Pick an instance in the Instance selector at the top right. Instances are identified by service and host name.
| Card | Shows | Metrics |
|---|---|---|
| CPU Utilization | Process CPU usage, split between user and system time | process.cpu.utilization |
| Memory Usage | Memory used by the process | process.memory.usage |
| V8 Heap Memory | JavaScript heap used, and its limit | v8js.memory.heap.used, v8js.memory.heap.limit |
| Event Loop | Event loop utilization, and P99 delay | nodejs.eventloop.utilization, nodejs.eventloop.delay.p99 |
A high event loop delay means your process is blocked by synchronous work, which slows down every request it handles.
Setup
The AdonisJS agent collects these metrics by default. Set hostMetrics: false in config/monocle.ts to turn off CPU and memory collection.
Each instance needs a service.instance.id resource attribute. The agent uses the HOSTNAME environment variable, which is set automatically in Docker and Kubernetes. Without it, each restart appears as a new instance.
Only instances that reported in the last 15 minutes are listed. If your service is stopped, this page shows no data even for past time ranges.