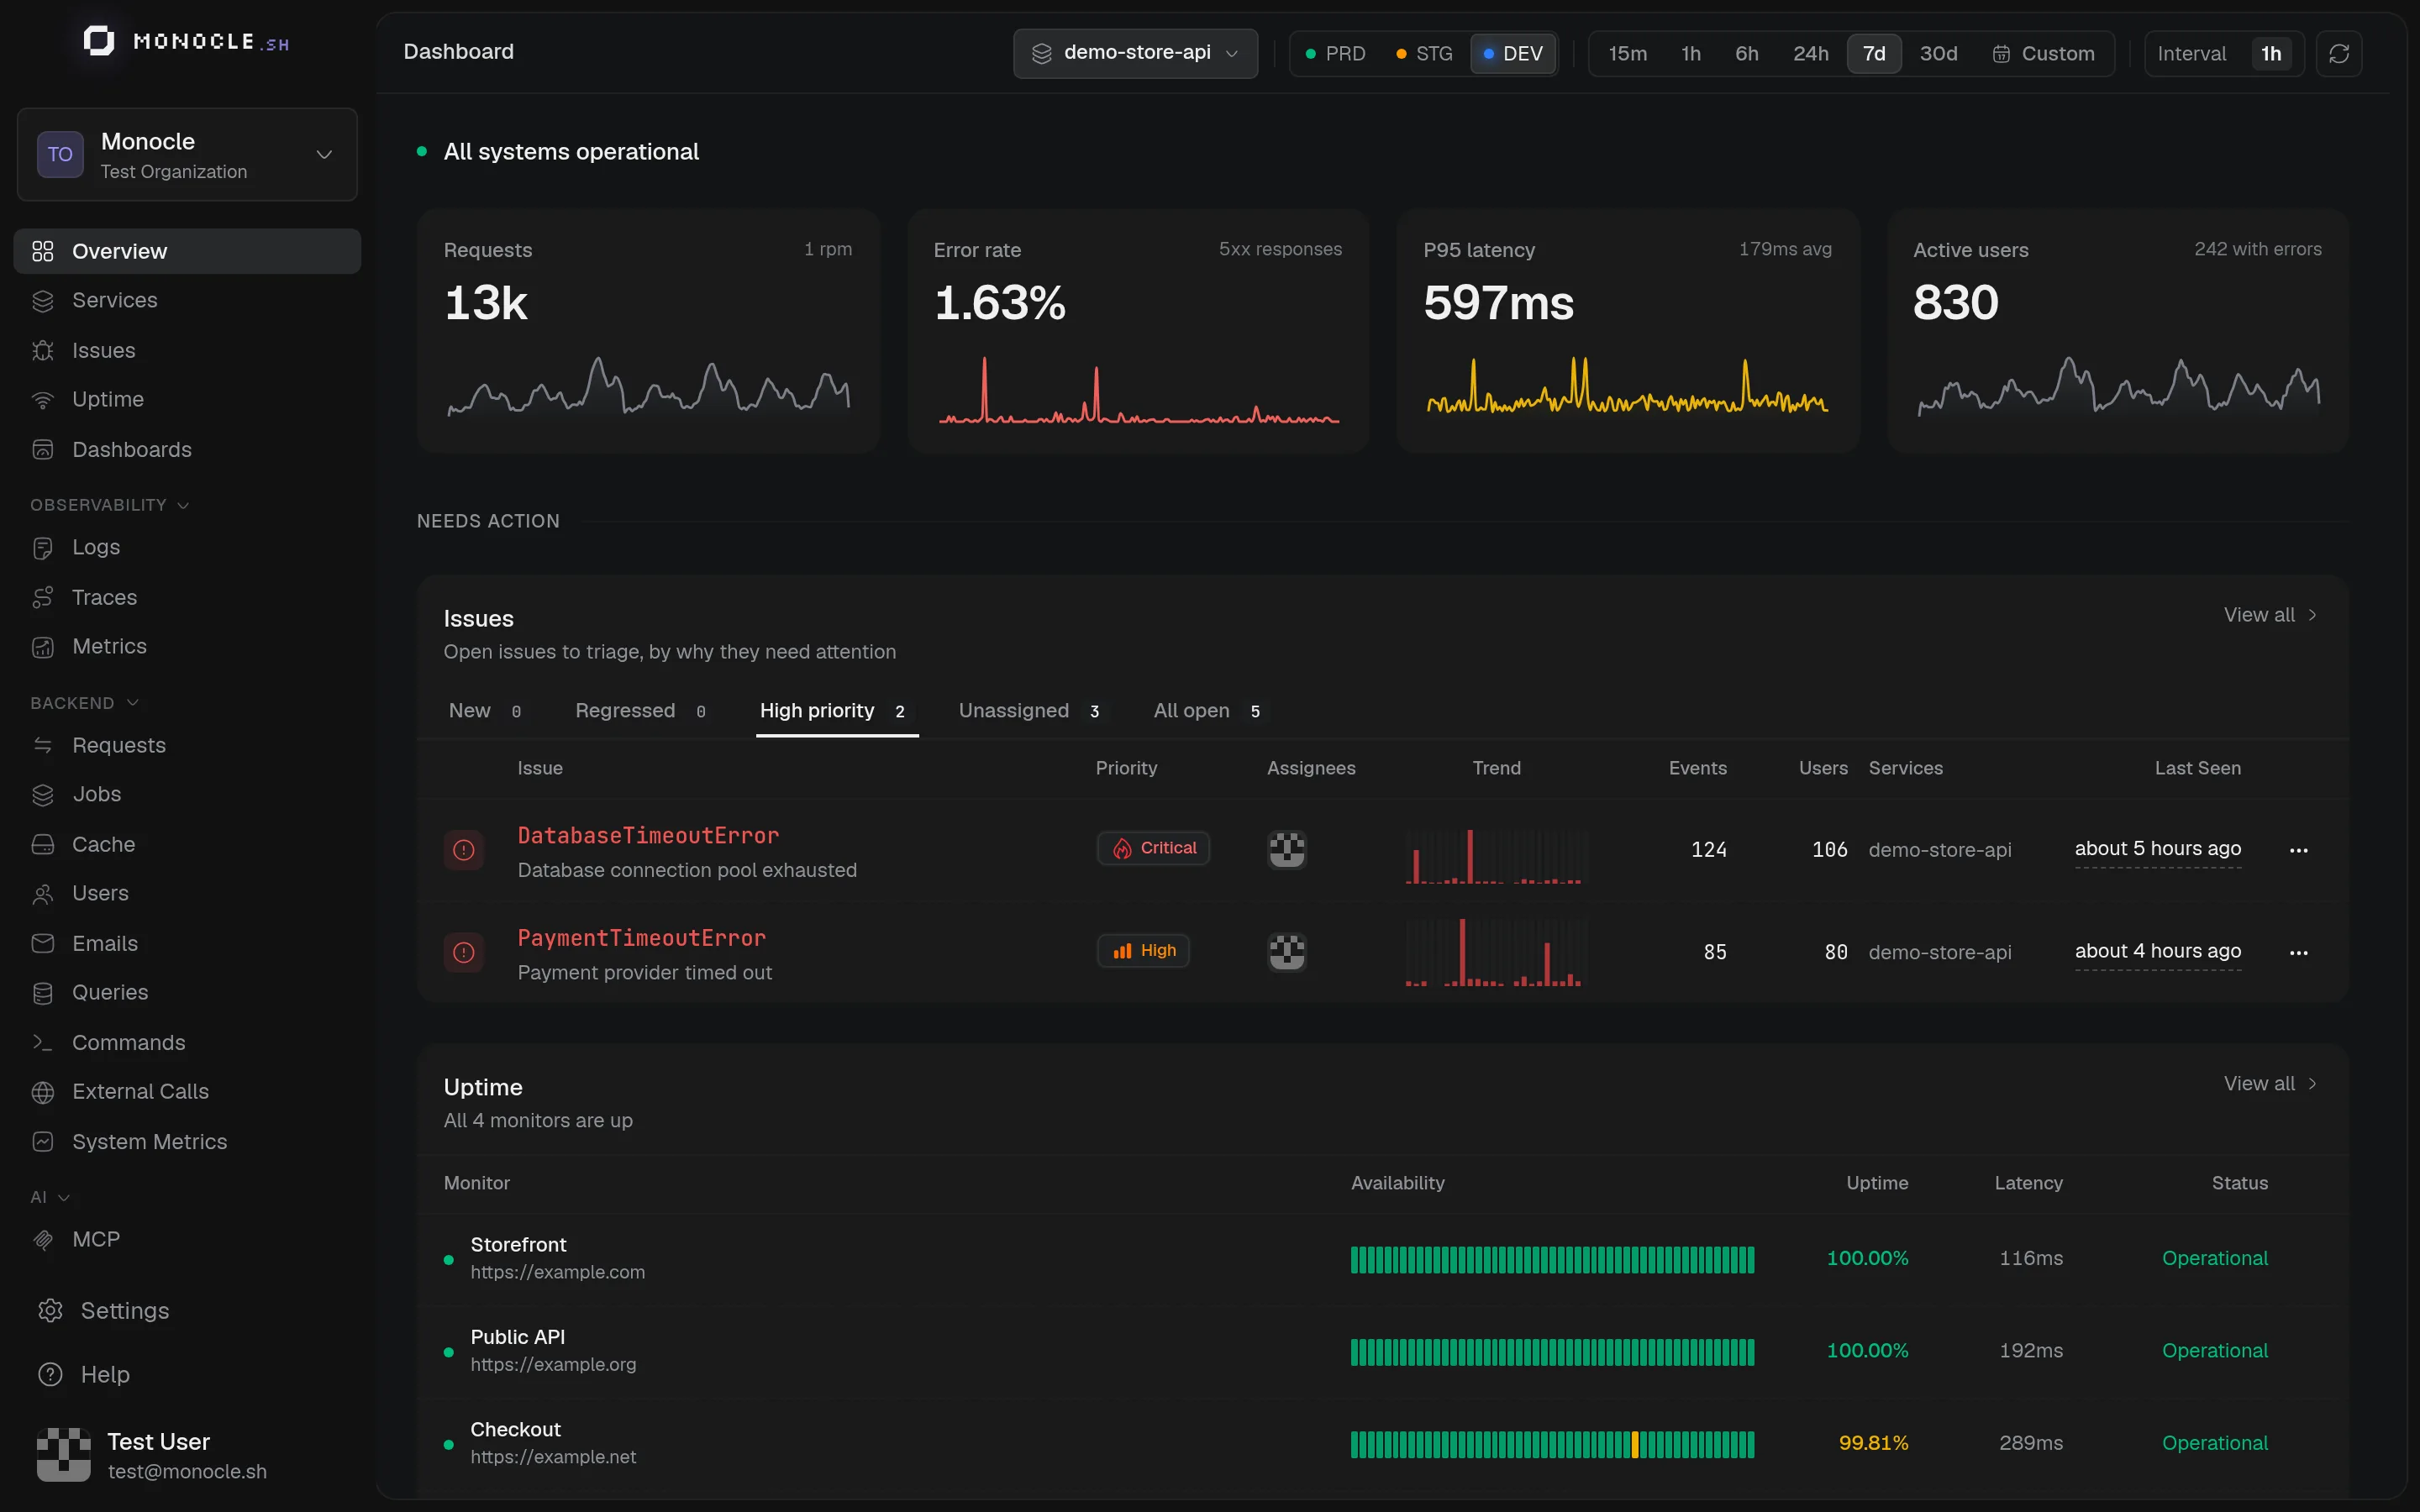
Monocle shows you what your application is doing in production: every request, query, job, log line, and exception, connected in a single timeline. Install the agent, deploy, and the dashboards fill in on their own.
Get started
Send your first trace to Monocle in about five minutes
Full guide to the AdonisJS agent and its options
The same visibility on your machine while you develop
Let Claude Code or Cursor query your telemetry
What you get out of the box
As soon as the agent runs, Monocle collects:
- Traces for every request, job, and command, with the full span waterfall across your services
- Issues: exceptions grouped by root cause, with stack traces, source code context, and the users they affected
- Logs linked to the trace that produced them
- Requests: throughput, error rate, and P95 latency of every endpoint
- Database queries: slow and failing queries, grouped by pattern
- External calls to third-party APIs
- Users: who hit an error or a slow page
- System metrics: CPU, memory, heap, and event loop
- Emails and commands for AdonisJS apps
Dedicated dashboards
Some workloads get their own dashboard once their instrumentation is enabled:
Throughput, failures, retries, and queue delays
LLM calls, tool usage, tokens, costs, and conversations
Hit rates and latency per cache key
How AI clients use the MCP server you expose
Health checks, incidents, alerts, and public status pages
Build your own charts on top of any telemetry
Built on OpenTelemetry
Your telemetry stays portable. Monocle uses standard OpenTelemetry protocols, so you can send the same data to Grafana, Honeycomb, or any OTLP-compatible backend alongside Monocle, and send data to Monocle from any OpenTelemetry SDK.