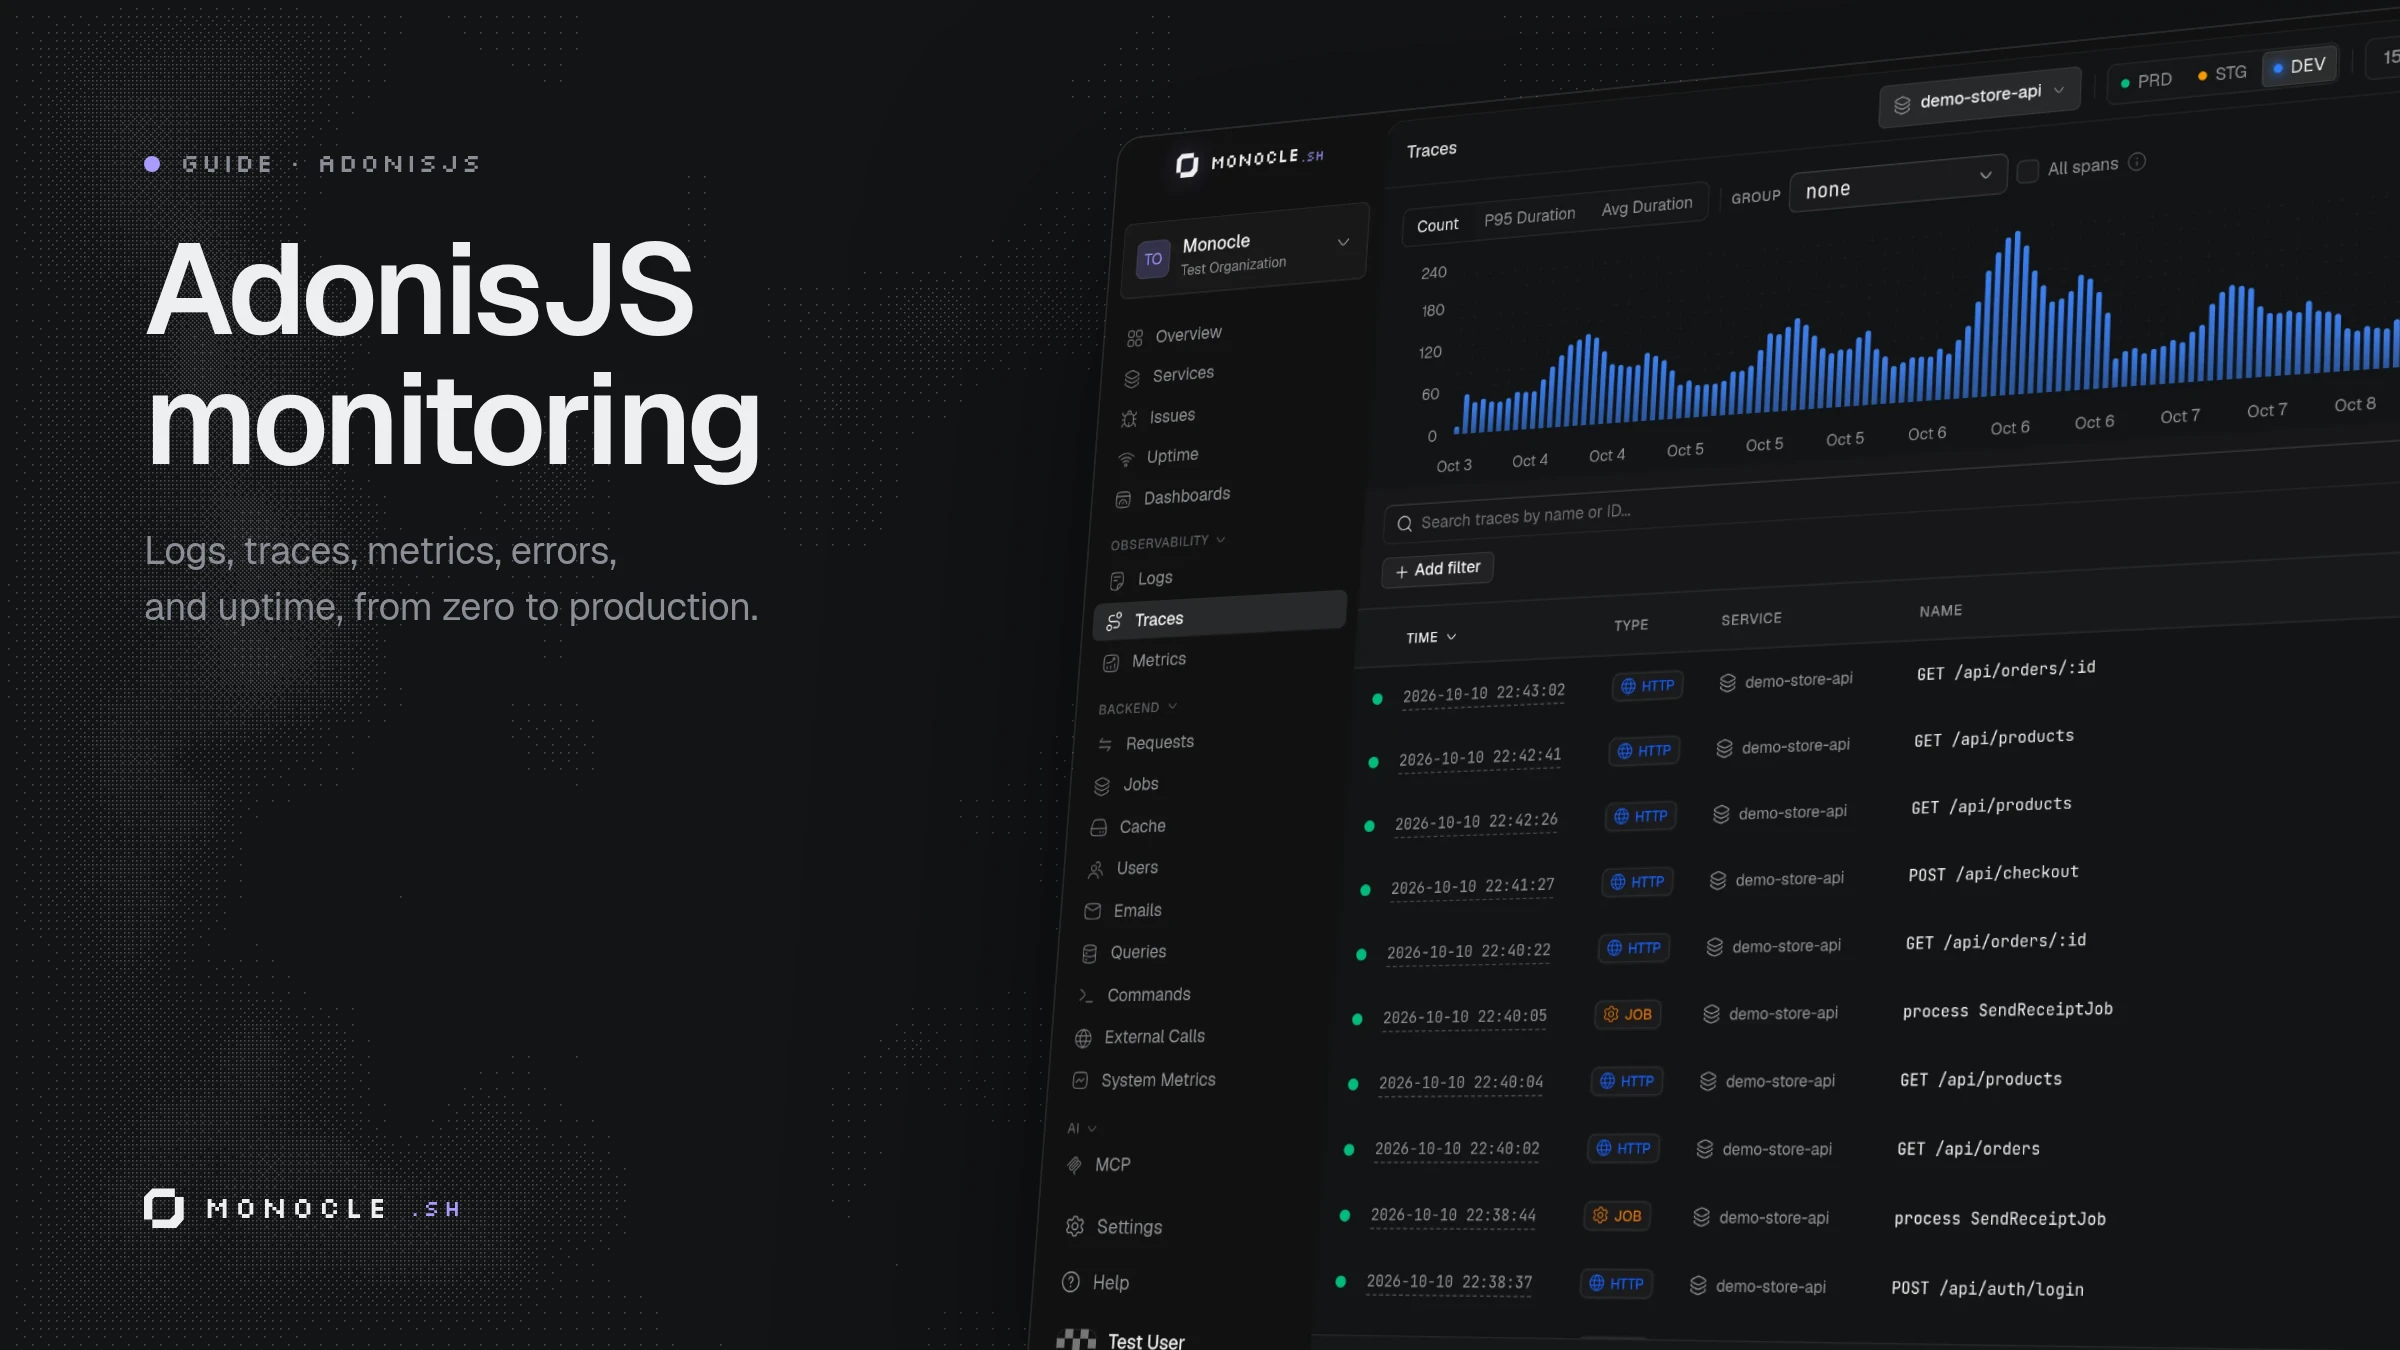
AdonisJS monitoring: the complete guide
Logs, traces, metrics, errors, and uptime for an AdonisJS app: what the framework gives you, what @adonisjs/otel, Prometheus, and Sentry add, and how to get all of it with one command.
Your AdonisJS app works on your machine. Then it runs in production, a user says checkout is slow, and you have no idea which query, which job, or which external API is to blame.
Monitoring an AdonisJS app means answering a few questions quickly: is it up, is it slow, is it failing, and why. This guide goes through the tools you can use for each part, from what ships with the framework to dedicated services, with the setup for each one and where it stops.
I'm on the AdonisJS core team, I wrote @adonisjs/otel and @julr/adonisjs-prometheus, and I
build Monocle. Every tool in this guide is a fine choice for some teams, and I'll say which ones.
What to monitor in an AdonisJS app
Five signals cover most of what goes wrong in production:
- Logs tell you what the app said while it ran.
- Traces show where the time went in one request: the middleware, the Lucid queries, the Redis calls, the API you called.
- Metrics count things over time: requests per second, error rate, P95 latency, memory.
- Errors group exceptions so you see each bug once, with how often it happens and who it hits.
- Uptime checks call your app from the outside and tell you when it stops answering.
No single open source tool covers all five, so the usual setup combines several. Let's go through them.
Logs: the built-in logger
AdonisJS ships with a logger built on Pino. There is nothing to install. During a request, use ctx.logger instead of the global logger: every line it writes carries the request ID, so you can find all the logs of one request.
import type { HttpContext } from '@adonisjs/core/http'

export default class OrdersController {
  async store({ logger, request }: HttpContext) {
    logger.info({ cartId: request.input('cartId') }, 'Creating order')
  }
}
The configuration lives in config/logger.ts. In production, write JSON to stdout and let your platform collect it. Use redact to keep secrets out of your logs:
import env from '#start/env'
import app from '@adonisjs/core/services/app'
import { defineConfig, targets } from '@adonisjs/core/logger'

export default defineConfig({
  default: 'app',
  loggers: {
    app: {
      enabled: true,
      name: env.get('APP_NAME'),
      level: env.get('LOG_LEVEL'),
      redact: { paths: ['password', '*.password'] },
      transport: {
        targets: targets()
          .pushIf(!app.inProduction, targets.pretty())
          .pushIf(app.inProduction, targets.file({ destination: 1 }))
          .toArray(),
      },
    },
  },
})Logs are only useful once they are collected and searchable, so you still need a place to send them (Loki, Elasticsearch, your host's log viewer). And a log line tells you something happened, not that the request spent 2 seconds waiting on one query.
Traces: @adonisjs/otel
OpenTelemetry is the standard for traces, metrics, and logs. The official @adonisjs/otel package sets it up for you:
node ace add @adonisjs/otelThe command creates config/otel.ts and an otel.ts file at the root of the project, imports otel.ts first in bin/server.ts, and registers a provider and a middleware. The import has to come first: OpenTelemetry patches libraries like http and knex when they load, so it must load before them.
Out of the box you get:
- A trace for each HTTP request, named after its route (
GET /users/:id, not justGET) - Spans for outgoing HTTP calls, Lucid queries (through Knex), and Redis commands
- Logs from the AdonisJS logger, linked to the trace that wrote them
- The current user attached to spans when you use
@adonisjs/auth
For your own code, wrap it in a span with record() or the @span() decorator:
import { record } from '@adonisjs/otel/helpers'

const order = await record('order.process', async (span) => {
  span.setAttributes({ 'order.id': orderId })
  return processOrder(orderId)
})
Two things to know:
- Ace commands and queue workers start from
bin/console.ts, which does not load OpenTelemetry by default. Importotel.tsat the top of that file too if you want to trace them. - By default, telemetry is sent over OTLP to
localhost:4318, the address of a local OpenTelemetry Collector.
@adonisjs/otel collects the data, it does not store or display it. Jaeger is fine on your
machine. In production it usually means Grafana Tempo for traces, Loki for logs, Prometheus or
Mimir for metrics, and Grafana on top, or a vendor that accepts OTLP. Then you build the
dashboards and the alerts yourself, and keep them working as your app changes, which is really
time consuming. Trust me, I've done it for years.
Metrics: OpenTelemetry, or Prometheus if you already run it
For metrics, my recommendation is to stay with OpenTelemetry. @adonisjs/otel already exports metrics over OTLP, next to the traces and logs, so there is nothing else to install. Your metrics share the service name and attributes of your traces, and they are pushed to your backend, so there is no endpoint to expose and protect.
Record your own with the standard OpenTelemetry API:
import { metrics } from '@opentelemetry/api'

const meter = metrics.getMeter('store')
const checkoutDuration = meter.createHistogram('checkout.duration', { unit: 's' })

checkoutDuration.record(0.42, { 'payment.provider': 'stripe' })
Already on Prometheus?
If your team already runs Prometheus and Grafana, keep them. @julr/adonisjs-prometheus exposes the metrics of your app on a /metrics endpoint for Prometheus to scrape:
node ace add @julr/adonisjs-prometheusexport default defineConfig({
endpoint: '/metrics',
metricsPrefix: env.get('APP_NAME'),
// Leave empty to allow everyone, or restrict to your Prometheus server
ipsWhitelist: [],
collectors: [
httpCollector(),
mailCollector(),
lucidCollector(),
cacheCollector(),
systemCollector(),
],
})The collectors give you request counts and durations per route, Lucid query durations, @adonisjs/cache hits and misses, emails sent, and the default Node.js process metrics. A few notes:
- The Lucid collector needs
debug: trueinconfig/database.ts. - Version 2 is for AdonisJS 7. On AdonisJS 6, install
@julr/adonisjs-prometheus@^1. - With
enableExemplars: true, metrics carry the trace ID of the request, so Grafana can jump from a latency spike to an example trace.
Metrics are aggregates, whichever way you send them. They tell you the P95 of POST /orders
doubled at 14:02, not which request was slow or why. You need the traces for that, and a backend
to store and chart everything.
Errors: Sentry
Sentry is the most common error tracker for Node.js. Install its SDK and initialize it in its own file:
npm install @sentry/nodeimport * as Sentry from '@sentry/node'
Sentry.init({
dsn: process.env.SENTRY_DSN,
tracesSampleRate: 0.1,
})Sentry has to load before your app to instrument its dependencies. AdonisJS apps are ESM, so Sentry recommends loading this file with node --import, for example node --import ./instrument.js bin/server.js, rather than importing it at the top of bin/server.ts.
Then report exceptions from your exception handler, so errors that AdonisJS already filters (like validation errors) stay out:
import * as Sentry from '@sentry/node'
import { ExceptionHandler, type HttpContext } from '@adonisjs/core/http'

export default class HttpExceptionHandler extends ExceptionHandler {
  async report(error: unknown, ctx: HttpContext) {
    if (this.shouldReport(error as any)) {
      Sentry.captureException(error)
    }

    return super.report(error, ctx)
  }
}
Sentry is good at what it does: grouping, release tracking, source maps, and assigning issues to people.
Sentry is built for errors first. Its tracing instruments Node.js libraries, but it has no
AdonisJS integration, so routes, Ace commands, and @adonisjs/queue jobs are up to you. And since
@sentry/node runs its own OpenTelemetry setup, running it next to @adonisjs/otel in the same
process takes extra wiring (Sentry documents a skipOpenTelemetrySetup mode for this).
Uptime: health checks
The last question is the simplest: does the app answer? AdonisJS has health checks built in:
node ace configure health_checksThis creates start/health.ts, where you register checks, and a controller with a liveness and a readiness endpoint:
import db from '@adonisjs/lucid/services/db'
import { DbCheck } from '@adonisjs/lucid/database'
import { HealthChecks, DiskSpaceCheck, MemoryHeapCheck } from '@adonisjs/core/health'

export const healthChecks = new HealthChecks().register([
  new DiskSpaceCheck(),
  new MemoryHeapCheck(),
  new DbCheck(db.connection()),
])
The readiness endpoint returns a JSON report and a 503 when a check fails. Point an uptime service at it, and protect it with a secret header if the details should stay private.
An uptime check tells you the app is down or that the database stopped answering. It doesn't tell you why the checkout got slow for half your users. And you still need a service to call the endpoint every minute and alert you.
The do-it-yourself stack
Put together, a complete open source setup for an AdonisJS app looks like this:
- The AdonisJS logger, shipped to Loki or another log store
- @adonisjs/otel, exporting traces, metrics, and logs through a collector to Tempo, Mimir or Prometheus, and Loki
- Or @julr/adonisjs-prometheus for metrics, if Prometheus already scrapes your apps
- Grafana for dashboards, and Alertmanager for alerts
- Sentry for errors
- An uptime service calling your health checks
Each piece is solid, and if your team already runs Grafana, adding @adonisjs/otel is the obvious move. But it is five or six services to deploy, upgrade, and connect to each other, and a set of dashboards to build and keep in sync with your app. When something breaks, you still jump from the error in Sentry to the trace in Grafana to the logs in Loki.
Monocle: all of it in one command
I built Monocle because I wanted all of this without running any of it. The AdonisJS agent is built on @adonisjs/otel, and installs the same way:
node ace add @monocle.sh/adonisjs-agentThe command writes config/monocle.ts and otel.ts, imports otel.ts first in both bin/server.ts and bin/console.ts, registers the provider and the middleware, and adds MONOCLE_DSN and APP_ENV to your environment. Set the DSN, deploy, and you get:
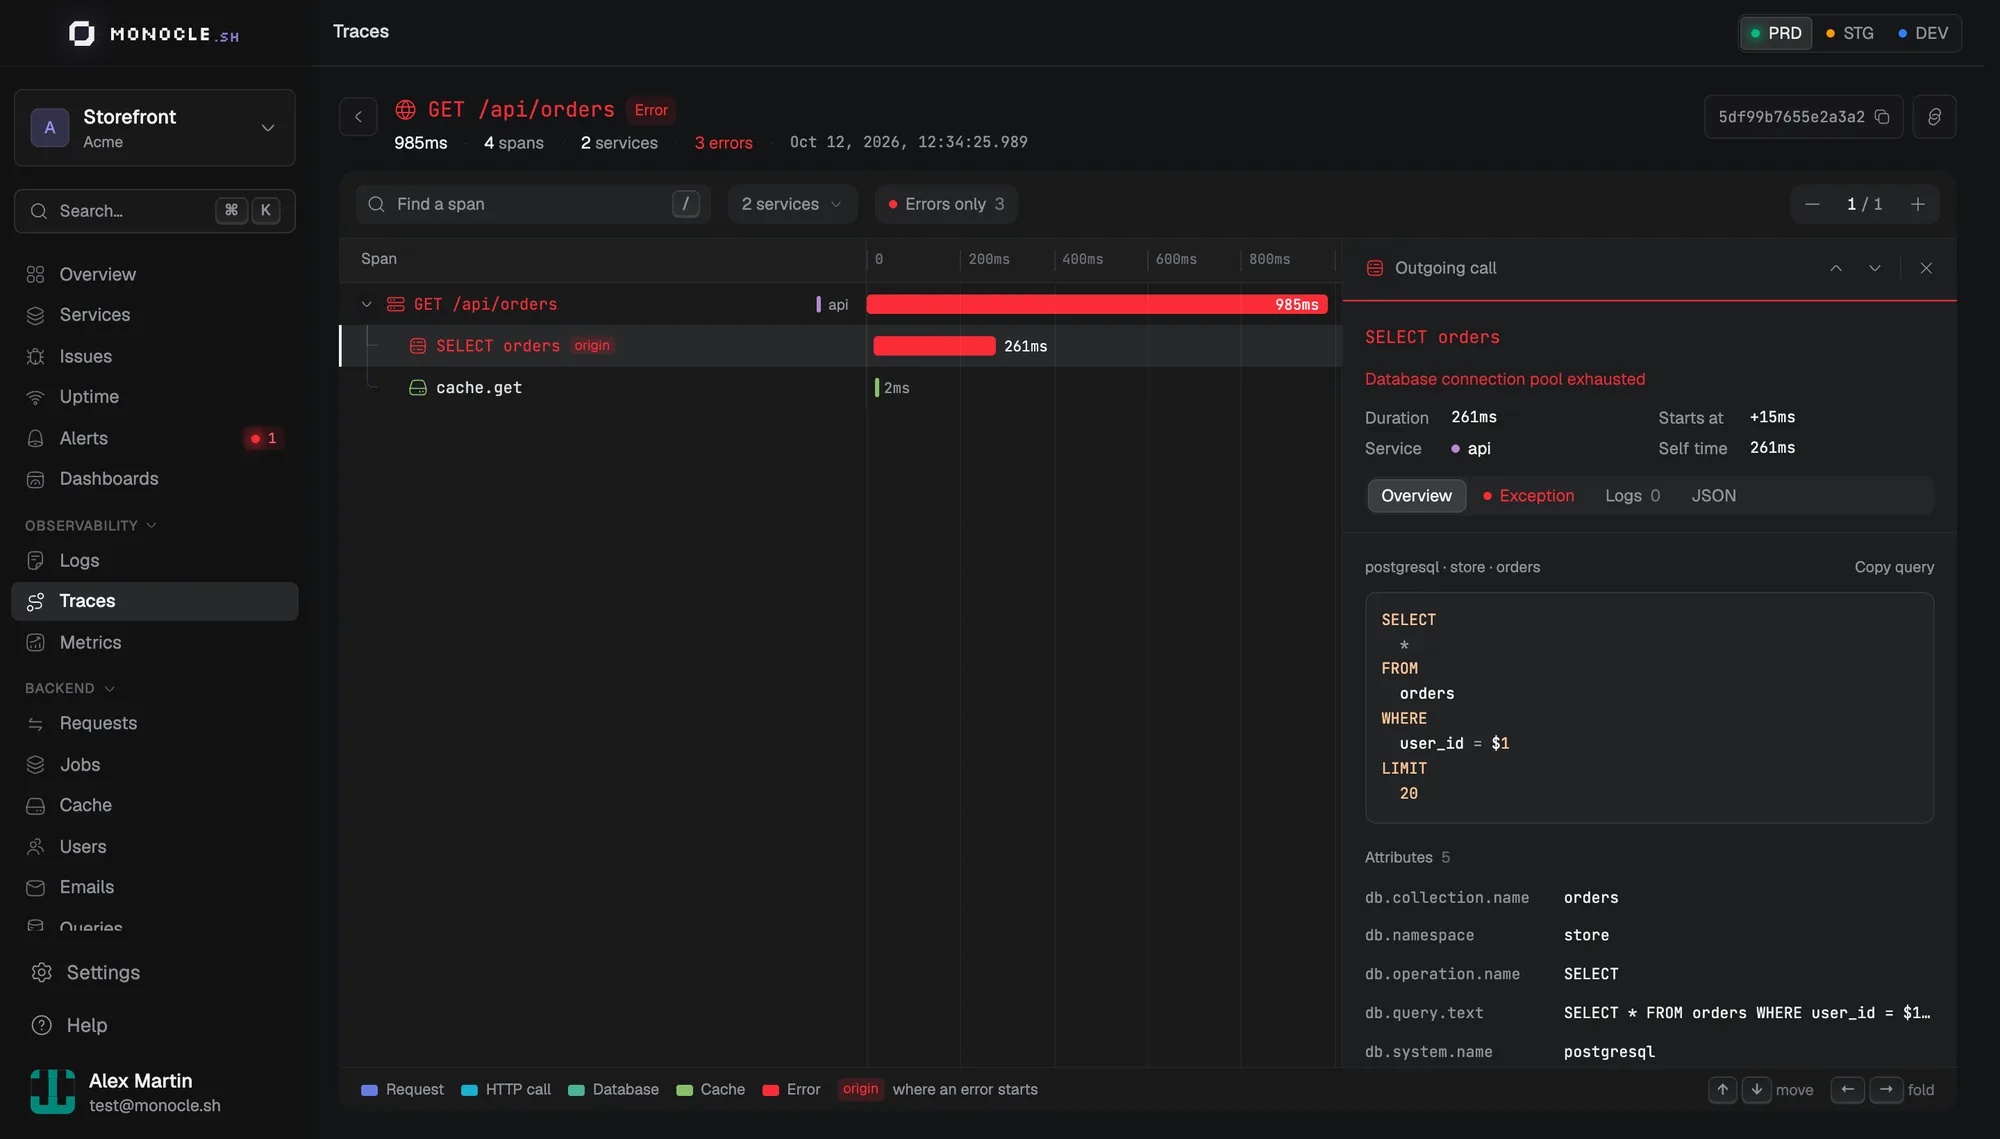
- Traces for every HTTP request, Lucid query, Redis command, outgoing HTTP call,
@adonisjs/mailemail,@adonisjs/queuejob, and Ace command, with no extra import for the CLI - Logs from the AdonisJS logger, linked to their trace
- Metrics: CPU, memory, heap, and event loop per instance, plus any OpenTelemetry metric you record, ready to chart
- Exceptions captured from
ExceptionHandler.report(), respecting yourignoreStatusesandignoreCodes, and grouped into issues with the users they hit - Dashboards for endpoints, queries, jobs, commands, emails, and users, ready as soon as data arrives
- Uptime monitors that read the AdonisJS health checks report, and alerts by email, Slack, Discord, or webhook
And because the same project covers your frontend, you also get what no backend tool sees:
- Frontend errors from the browser SDK, with every
fetchlinked to the AdonisJS trace it triggered, so you follow a click down to the Lucid query - Session replays of the visits that hit an error, including the minute before it, with form fields masked in the browser and recording only after consent
- Product analytics without cookies, so no consent banner: visitors, sources, and funnels to see where users drop off
In development, the generated config sets dev: true, so telemetry goes to Monocle Studio, which stores it on your machine and shows it on localhost:4200.
If you already use @adonisjs/otel, the migration is a package swap and a change of import paths: record(), @span(), and @spanAll() work the same. And because it is OpenTelemetry underneath, you can send the same data to another OTLP backend, like Grafana, alongside Monocle.
To be fair about the limits: Monocle is a hosted service with data in the EU, there is no self-hosted version, and it is a paid product after a 14-day trial. If you need everything on your own servers, the do-it-yourself stack above is the way to go.
Which one should you pick?
- A side project: the built-in logger and an uptime check on your health endpoint get you far.
- Your team already runs Grafana: add
@adonisjs/oteland send everything to the stack you know. If Prometheus already scrapes your apps,@julr/adonisjs-prometheusfits right in. - Your company standardized on Sentry: keep it for errors, and use
@adonisjs/otelwith another backend for traces, or check how Sentry's own tracing fits. - You want traces, logs, errors, dashboards, and uptime, for your API and your frontend, without running infrastructure: try Monocle. The AdonisJS setup guide takes a couple of minutes.
Whatever you choose, set it up before the next incident, not during it.
See what your apps
are really doing.
Traces, logs, errors and metrics for every app you ship. Bring it all into focus.