AdonisJS monitoring,
in one command.
Monocle traces every request, Lucid query, queue job, email, and Ace command of your AdonisJS app, with its logs and exceptions attached. Run node ace add, set one variable, deploy. No collector to run, no dashboard to build.
node ace add, nothing else to wire
Named after its route, with its queries
Straight from your exception handler
Standard OpenTelemetry
What Monocle monitors in your AdonisJS app
HTTP requests
One trace per request, named after its route
Lucid queries
Every query as a span, grouped by pattern
Redis and outgoing HTTP
Each command and API call, in its request
Logger output
ctx.logger lines linked to their trace
Exceptions
Reported by your exception handler
@adonisjs/mail
Every email sent, when installed
@adonisjs/queue
Jobs from dispatch to execution
Ace commands
With their arguments and flags
Host metrics
CPU, memory, and network
One command, and your app reports
The agent installs like any AdonisJS package. Its configure hook writes the config, loads OpenTelemetry before your app boots, and registers the provider and the middleware for you.
- Creates config/monocle.ts and otel.ts, and imports otel.ts first in bin/server.ts and bin/console.ts
- Registers the Monocle provider and middleware, and adds MONOCLE_DSN and APP_ENV to your env
- In development, telemetry goes to Monocle Studio on your machine, no DSN needed
// node ace add @monocle.sh/adonisjs-agent
import { defineConfig } from '@monocle.sh/adonisjs-agent'
import env from '#start/env'

export default defineConfig({
  // Send telemetry to Monocle Studio instead of Monocle cloud
  dev: process.env.NODE_ENV === 'development',
  dsn: env.get('MONOCLE_DSN'),
  environment: env.get('APP_ENV'),
})
Every request, down to the query
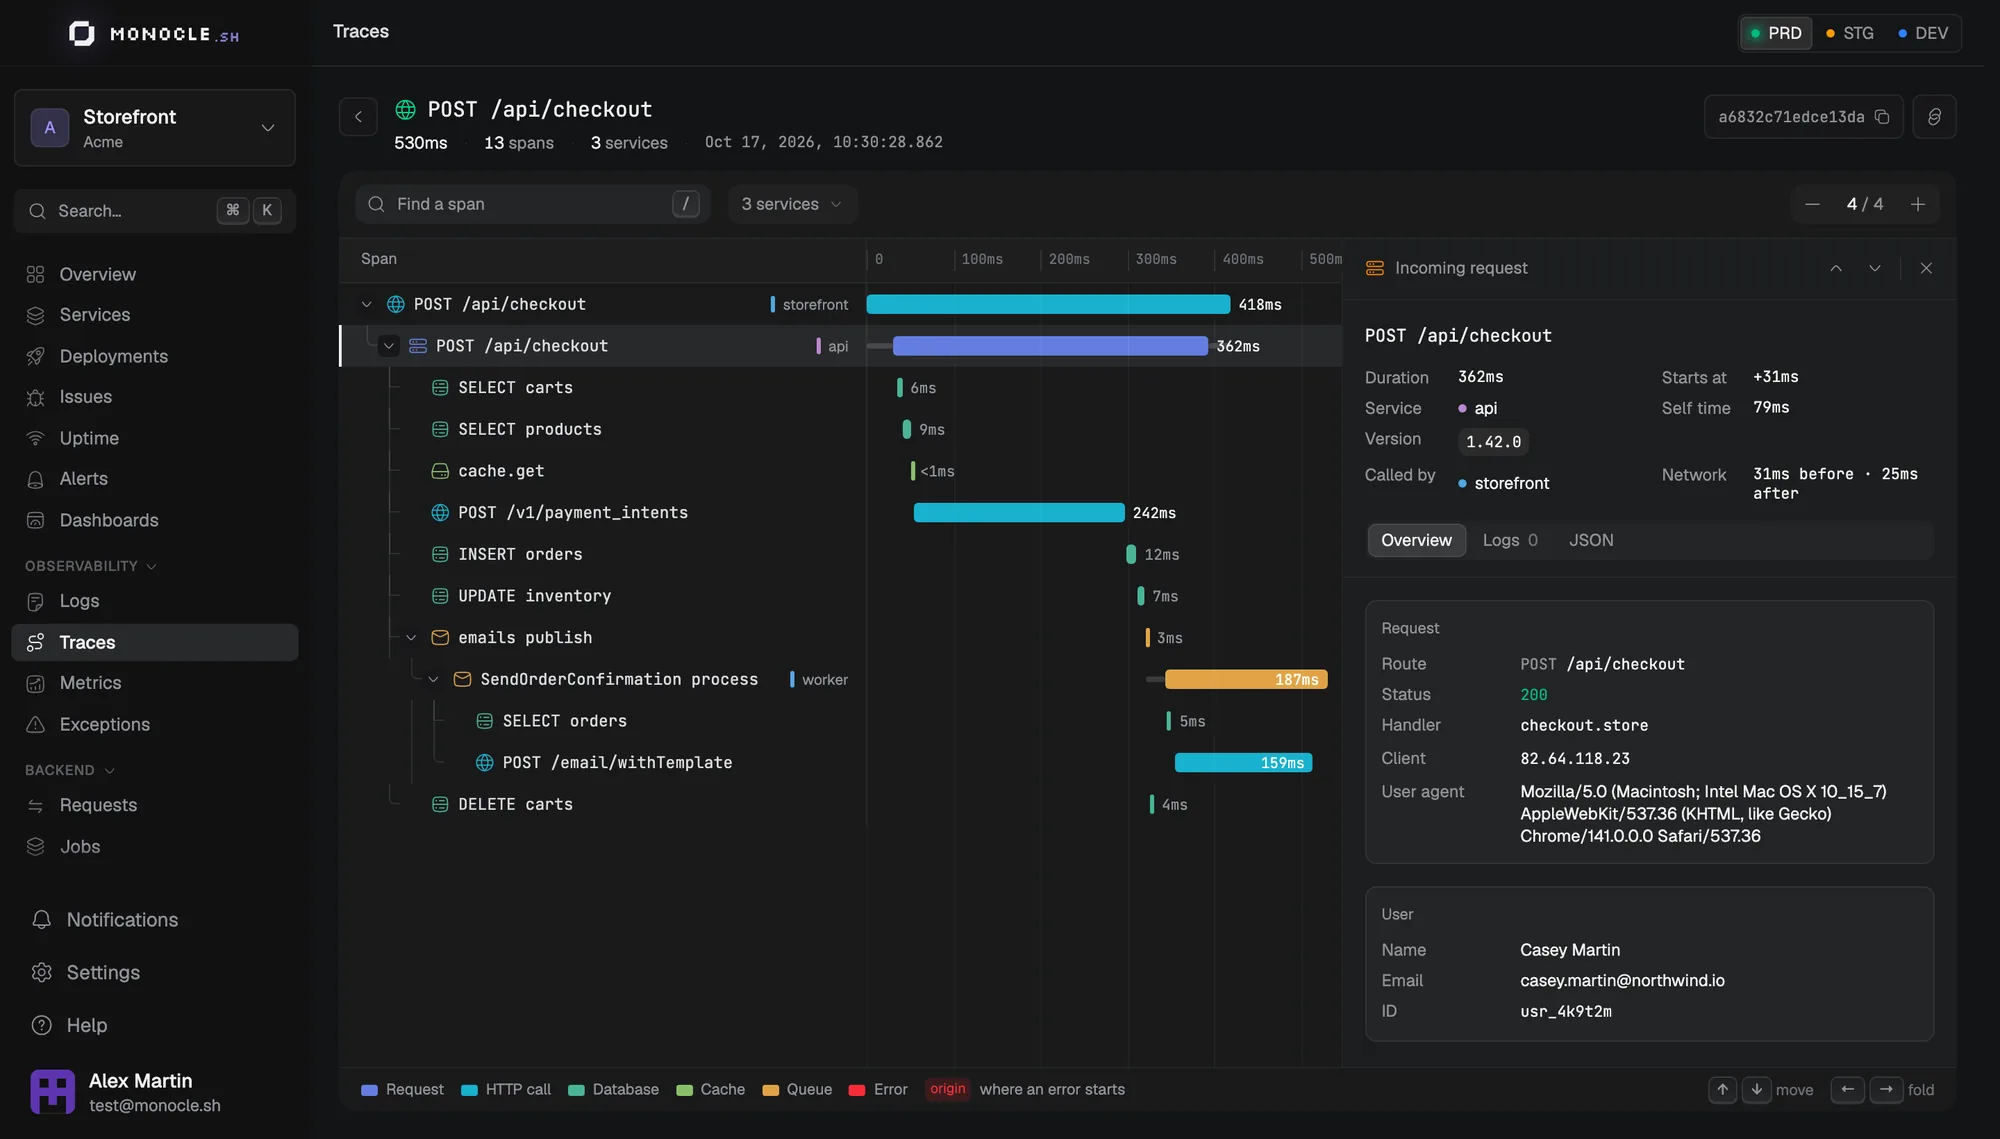
Every HTTP request becomes a trace named after its route, like GET /users/:id. The Lucid queries, Redis commands, outgoing HTTP calls, and emails it triggers are nested inside, with their timing.
- HTTP requests, Lucid queries, Redis commands, and outgoing HTTP calls
- @adonisjs/mail emails and @adonisjs/queue jobs, as soon as the packages are installed
- Ace commands with their arguments and flags, scaffolding commands left out
Logs and exceptions, tied to the request
Your AdonisJS logger output is sent with the trace and span that were active, so ctx.logger lines sit next to the request that wrote them. Exceptions reported by your exception handler become issues.
- Hooks into ExceptionHandler.report(), and respects ignoreStatuses, ignoreCodes, and ignoreExceptions
- Call Monocle.setUser() in your auth middleware, and every trace and issue knows its user
- Repeated errors are grouped into one issue, with the stack trace and the users it hit
A dashboard for every part of your app
Requests are grouped by route, queries by pattern, jobs by name. Each one gets its dashboard the moment your app sends data, with nothing to build.
- Endpoints with their 4xx, 5xx, and P95, and the slowest Lucid query patterns
- Jobs with their queue wait and retries, Ace commands, and emails sent
- CPU, memory, V8 heap, and event loop for each instance
Your own spans, when you need them
For business logic, wrap it in a span with the record() helper, or decorate a service. When something throws inside, the agent attaches the surrounding source code to the error.
- record() handles sync and async callbacks and records exceptions for you
- @span() and @spanAll() decorators for your services
- Coming from @adonisjs/otel? The API is the same, only the import path changes
import { record } from '@monocle.sh/adonisjs-agent/helpers'
import { span } from '@monocle.sh/adonisjs-agent/decorators'

export class ReportService {
  @span()
  async generate(userId: number) {
    const data = await record('report.load', () => load(userId))
    return render(data)
  }
}
Health checks your uptime monitor understands
Point an uptime monitor at the route that serves your AdonisJS health checks. Monocle reads the report and fails the check when your app says it is unhealthy, even on a 200 OK.
- Reads the format of the AdonisJS health checks module as is
- A check every minute, and an alert by email, Slack, Discord, or webhook
- A public status page on your own domain
Plugs into your stack
AdonisJS 6 and 7
From 6.2.0, zero config
Lucid
Every query as a span
@adonisjs/mail & @adonisjs/queue
Traced when installed
BullMQ
Jobs from enqueue to run
Bentocache & @adonisjs/cache
Hits, misses, and latency
Kysely & Drizzle
Queries with readable SQL
Vercel AI SDK & Mastra
LLM calls, tokens, and costs
Browser SDK
Frontend errors linked to your API
Other OTLP backends
Send the same data to Grafana too
See what your apps
are really doing.
Traces, logs, errors and metrics for every app you ship. Bring it all into focus.