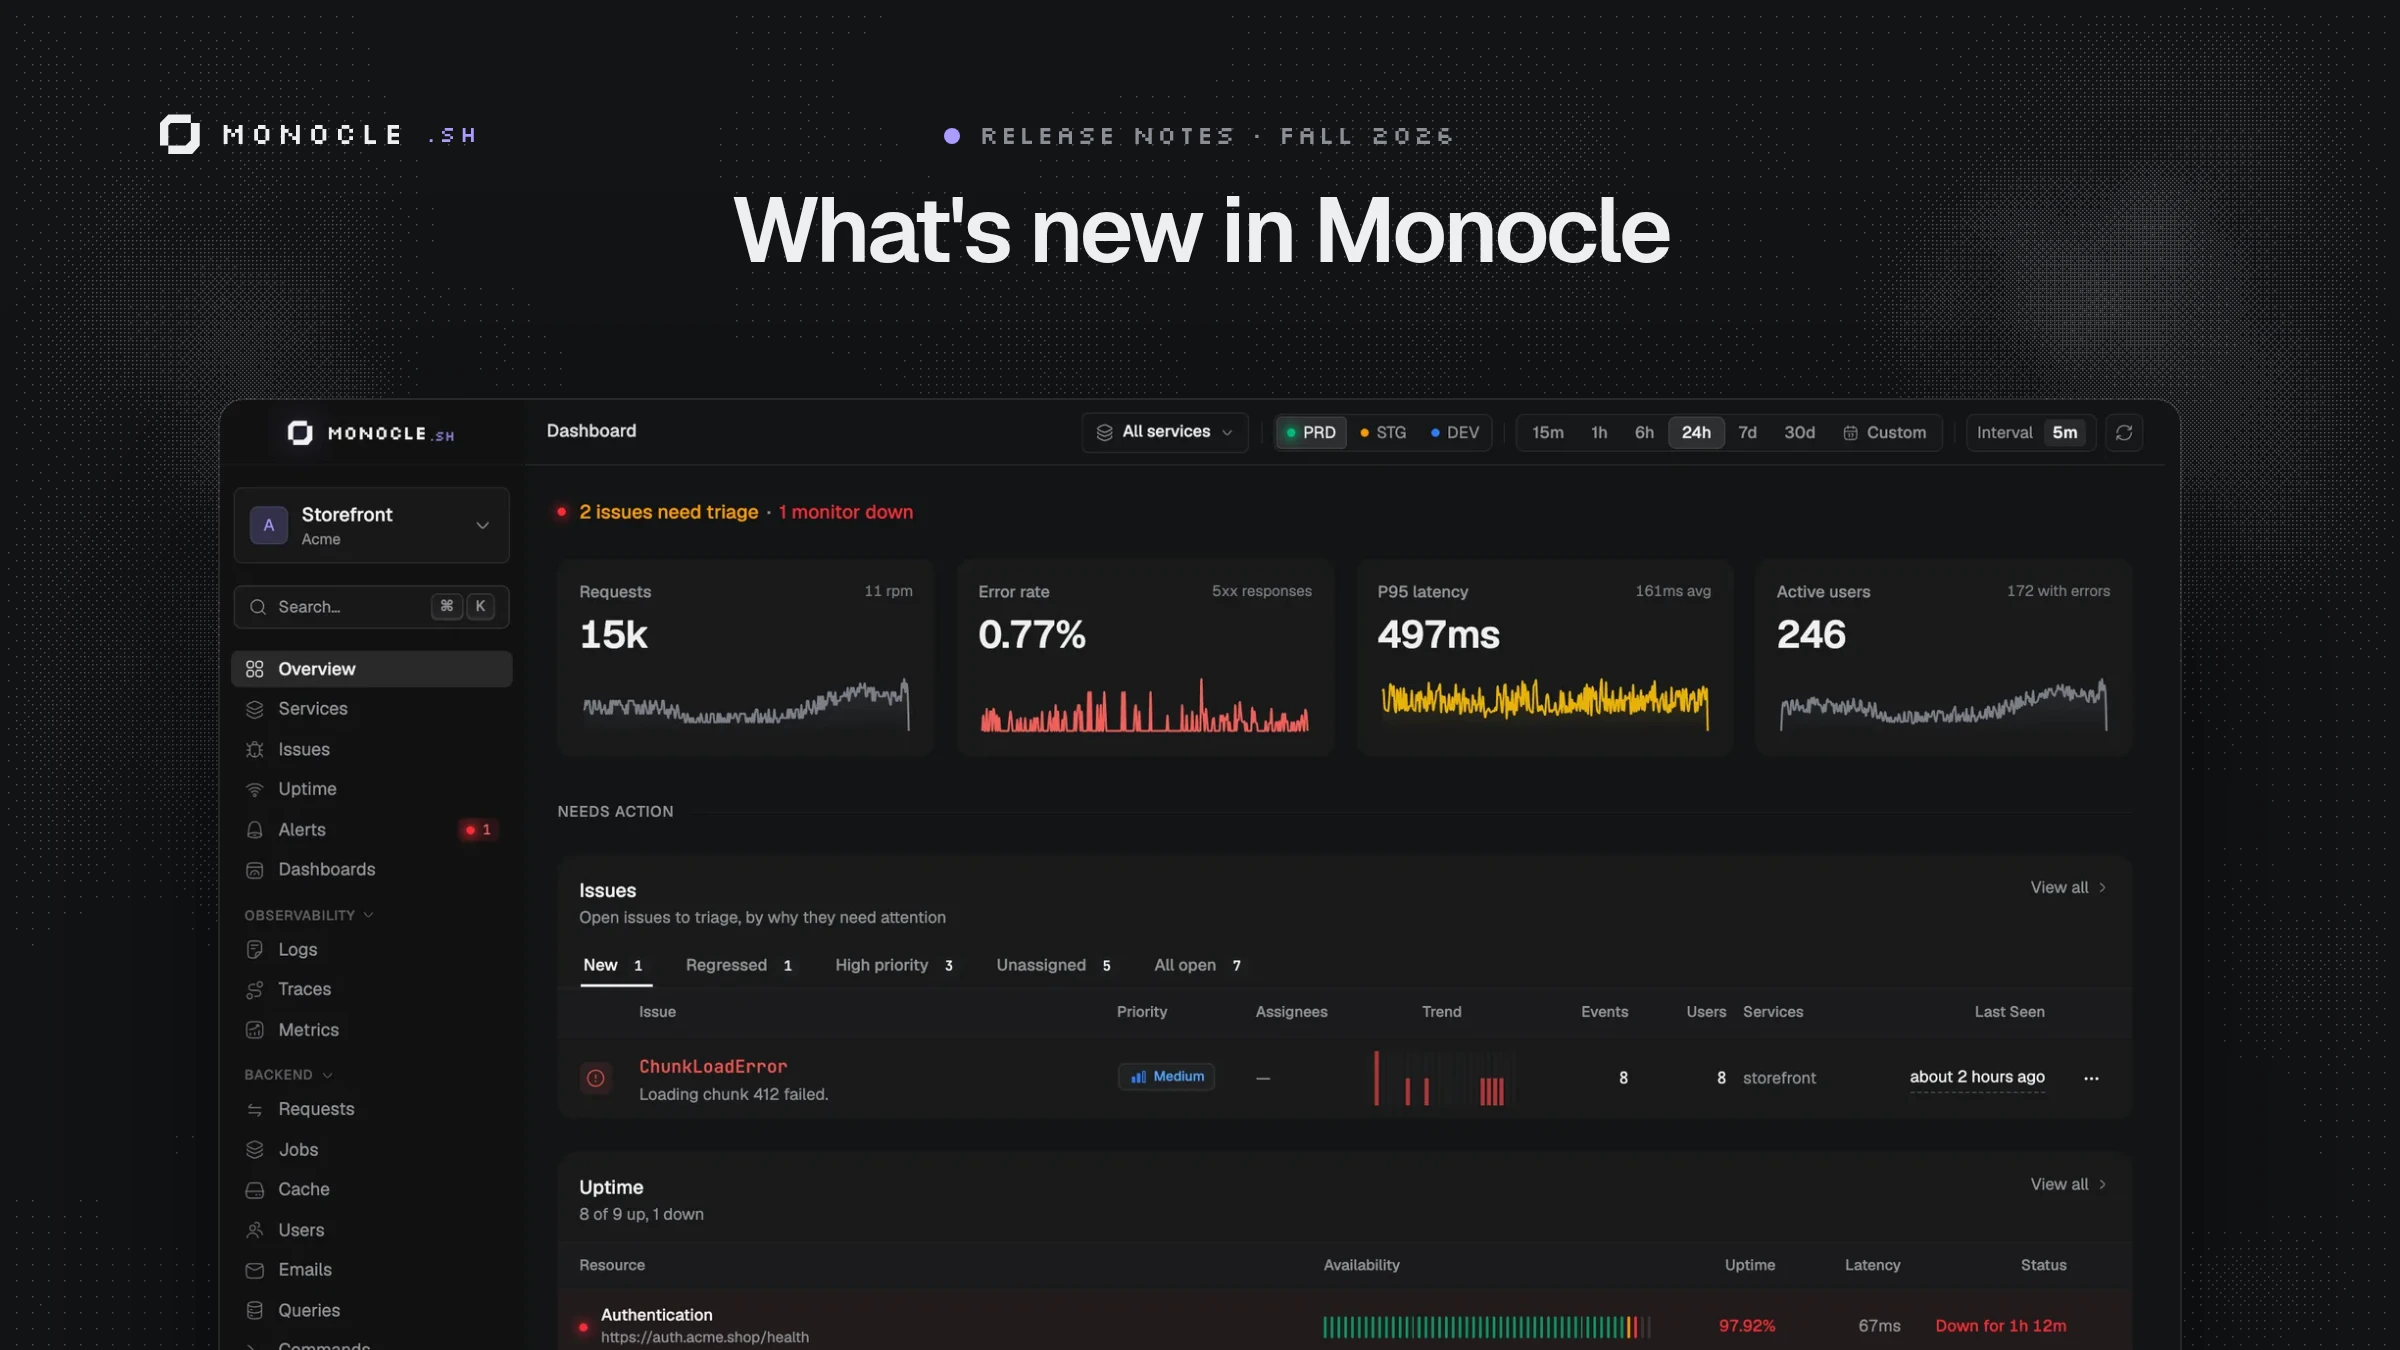
What's new in Monocle: frontend support, issues, alerts, and a whole new look
Multi-service projects and traces, a browser SDK, automatic issues, endpoint alerts, deployments, a reworked Uptime, and a redesign of almost every page. Here is everything that shipped since June, and the one migration you need to do.
TL;DR
- Projects now have services: your API, your worker, and your frontend live in one project, each with its own DSN.
- Monocle runs in the browser: a new browser SDK captures frontend errors and links every fetch to the backend trace it triggered.
- Traces cross services: a call to another service nests under its caller, clocks get corrected, and endpoints, queries, and commands are counted per service.
- Issues replace exceptions: one place for frontend and backend errors, with notifications when something new breaks or an old bug comes back.
- Alerts are here, starting with endpoints: latency, error rate, or traffic, with a preview of when they would have fired.
- Notification channels are the one place to set up Slack, Discord, and signed webhooks.
- Uptime monitors several resources per environment, and status pages get incidents and scheduled maintenance.
- Deployments: Monocle detects new versions from your telemetry, and you can declare deploys from your CI or GitHub.
- Almost every page was redesigned: the overview, Logs, Traces, the trace view, Metrics, custom dashboards, and settings.
- Press ⌘K to get anywhere in the app.
- AdonisJS agent 2.x makes integrations opt-in. If you use BullMQ, Vercel AI, Mastra, Bentocache, or MCP, you have a migration to do.
- Holmes is gone: we're focusing on the existing MCP server, with new tools for service setup and Uptime incidents.
- Onboarding gets agent-assisted setup and a checklist that follows your progress.
- Product analytics is in beta, and you can ask for access.
- Feedback and inbox: reply to feedback in the app and find your notifications in one place.
- The docs were rewritten, with a quickstart and a guide for any OpenTelemetry SDK.
It's been a few months since the last big update, and a lot happened. Some of it you asked for, some of it I needed myself, and some of it is the boring work that makes the rest possible. The rest of this post walks through all of it.
Projects now have services
Until now, a Monocle project was more or less one app. That stops working the day you add a worker, a second API, or a frontend. Now a project holds several services, and you see all their telemetry in one place.
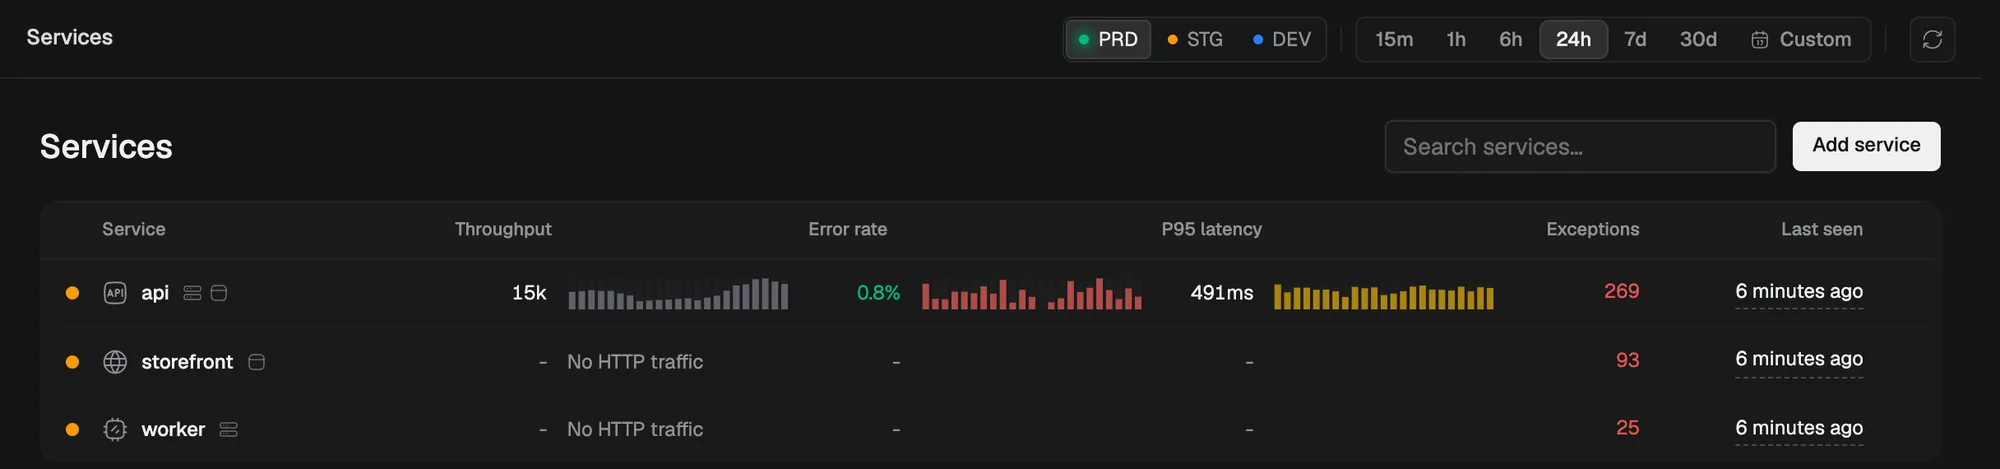
The Services page lists every service with its throughput, error rate, P95 latency, exceptions, and last activity. Click Add service, give it a name and an icon, and you're done.
A service selector now sits in the header. It filters the overview, traces, logs, issues, endpoints, queries, jobs, metrics, and every other telemetry view. Pick one service, a few, or all of them. The selection lives in the URL, so a link you share shows the same thing.
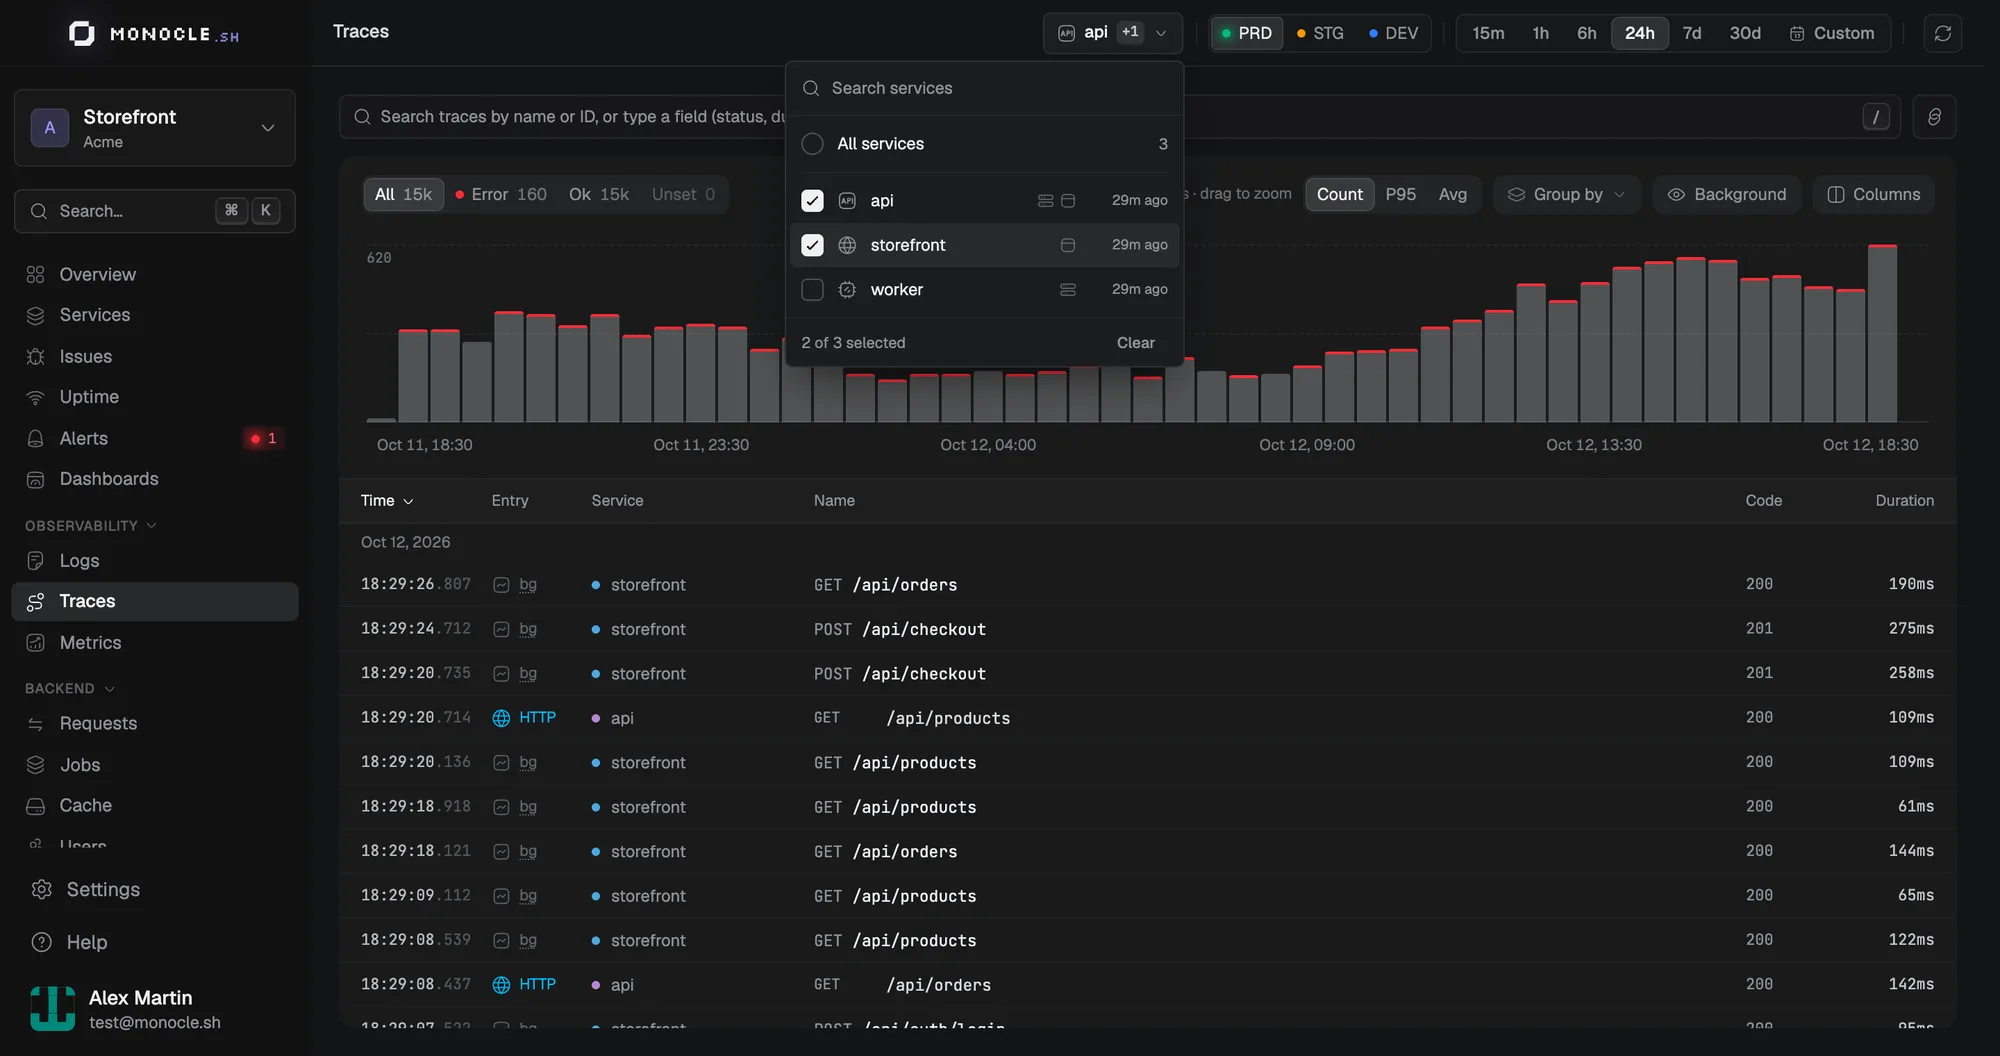
The trace view knows about services too. When a request goes from your API to a worker, you can filter the waterfall by service and still see the parent spans that led there.
One DSN per service
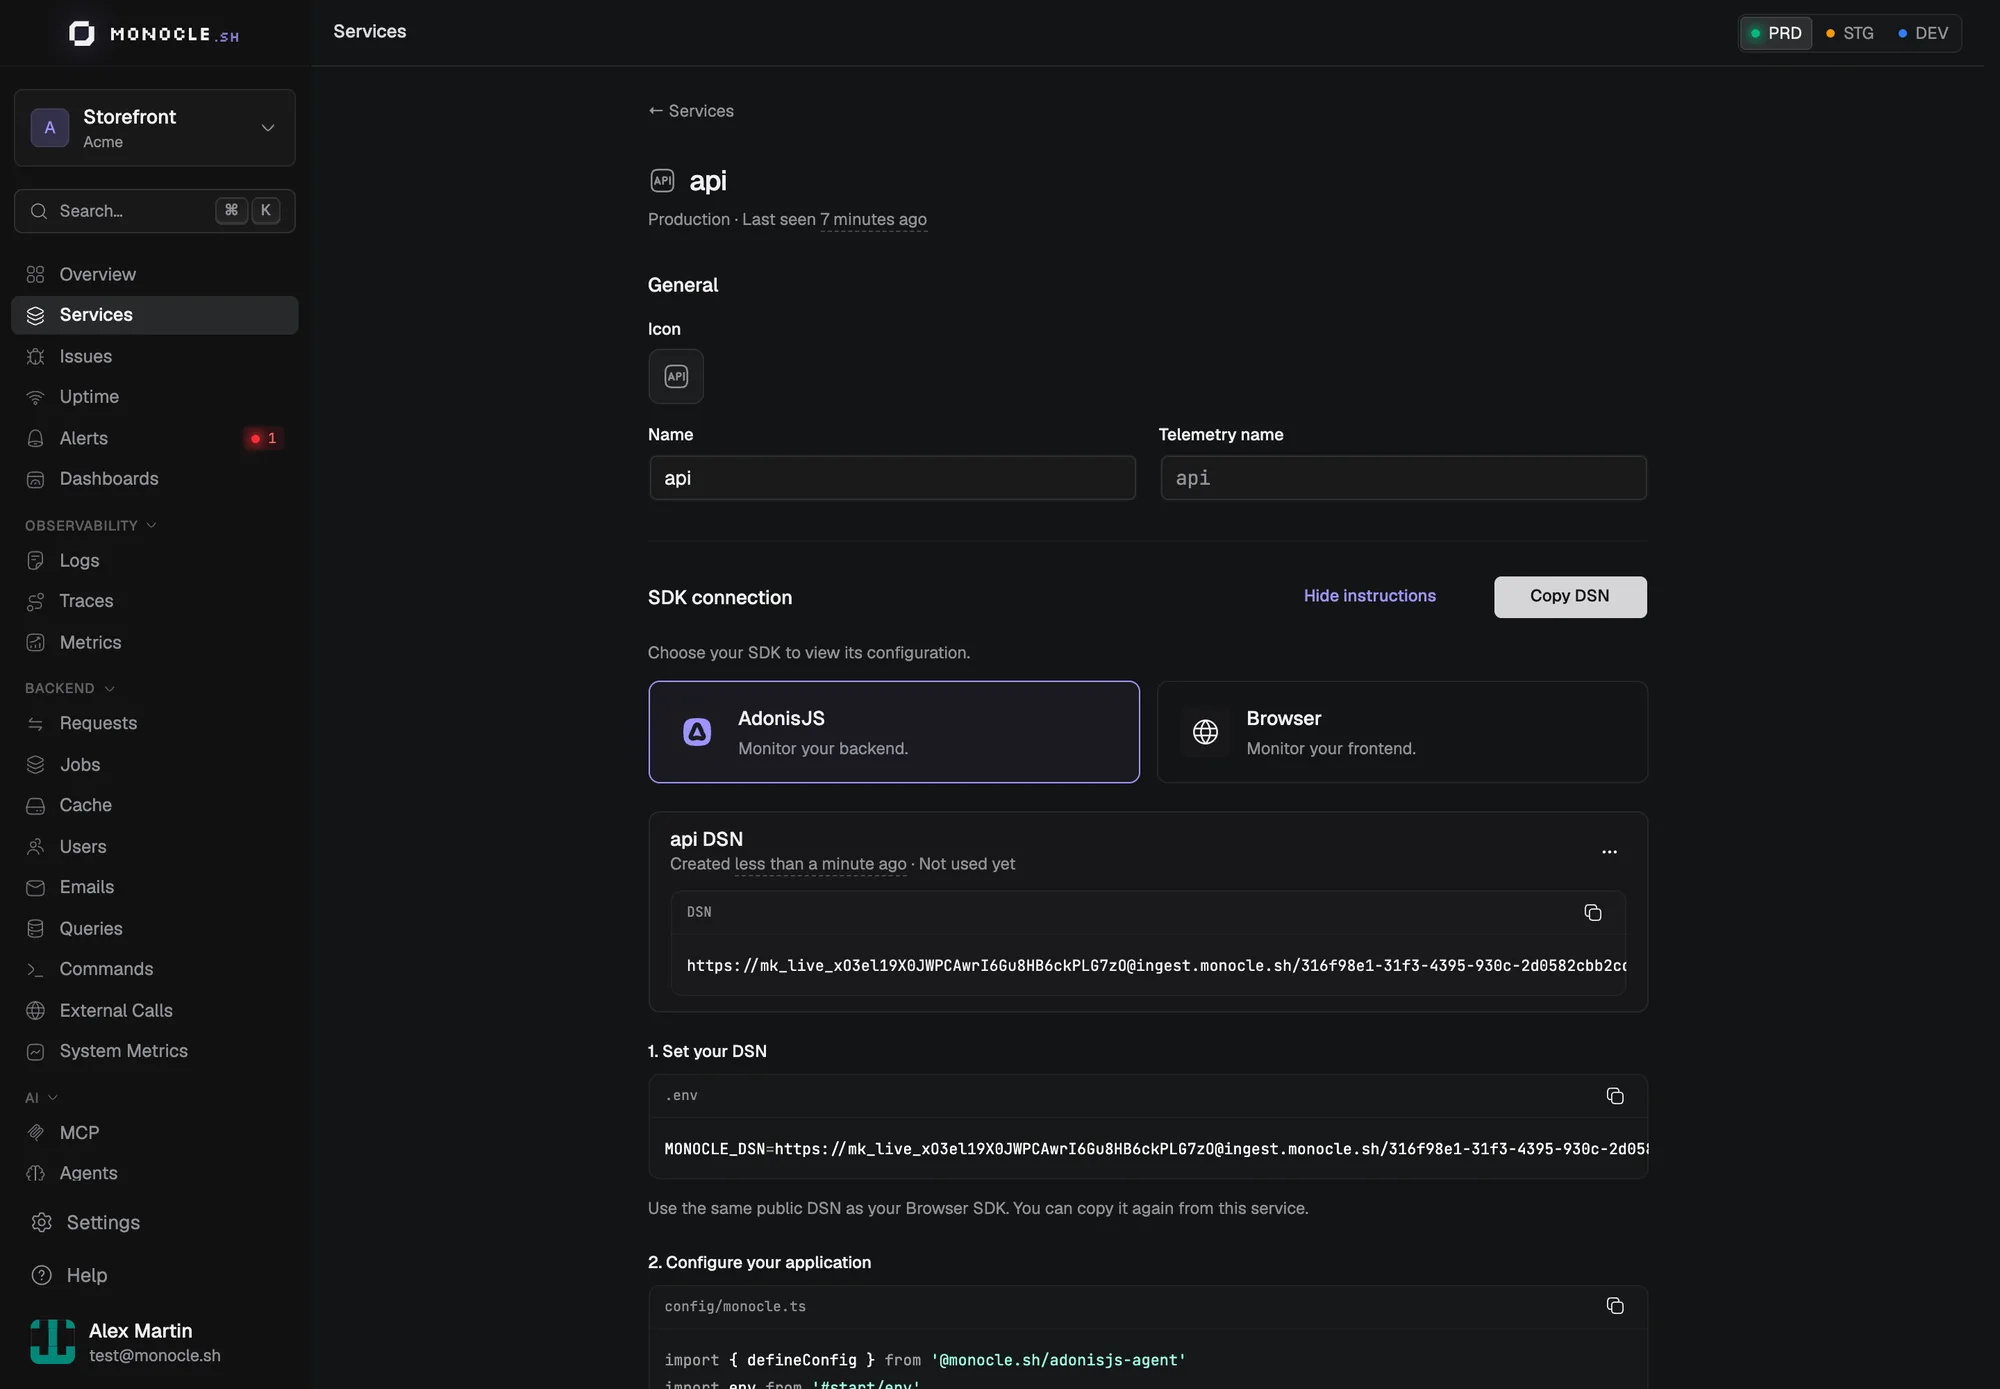
Each service gets a DSN. It replaces the API key, the service name, and the endpoint in your config with a single value:
MONOCLE_DSN=https://mk_live_xxxxxxxx@ingest.monocle.sh/<service-id>export default defineConfig({
dsn: env.get('MONOCLE_DSN'),
environment: env.get('APP_ENV'),
})Because the DSN points at the service, renaming a service in Monocle changes only its display name. You don't need to redeploy.
Your existing API keys still work, but we strongly recommend migrating to DSNs. You can migrate one service at a time with the DSN migration guide.
Monocle in the browser
Services and DSNs exist mostly for this. A frontend is a service like any other, with its own errors and its own traffic, and it needed a place in your project next to the API it talks to.
@monocle.sh/browser-sdk is that missing piece. Create a service for your frontend, pick Browser under SDK connection, and copy its DSN:
import { initMonocle } from '@monocle.sh/browser-sdk'

export const monocle = initMonocle({
  dsn: 'https://mk_live_xxxxxxxx@ingest.monocle.sh/<service-id>',
  environment: 'production',
})
Out of the box, the SDK captures uncaught errors and unhandled rejections, with their cause chains. It records fetch and XHR calls as spans and adds a traceparent header to same-origin requests. That header is what connects a click in the browser to the API request, the database queries, and the job it triggered, all in one trace. Console capture is available as an opt-in integration.
The SDK has no runtime dependencies, and it's what Monocle's own frontend runs. It sends no request bodies, headers, or cookies, and it strips query strings. A browser DSN is public by nature, so lock it to your domains with the service's website restrictions.
Traces that cross services
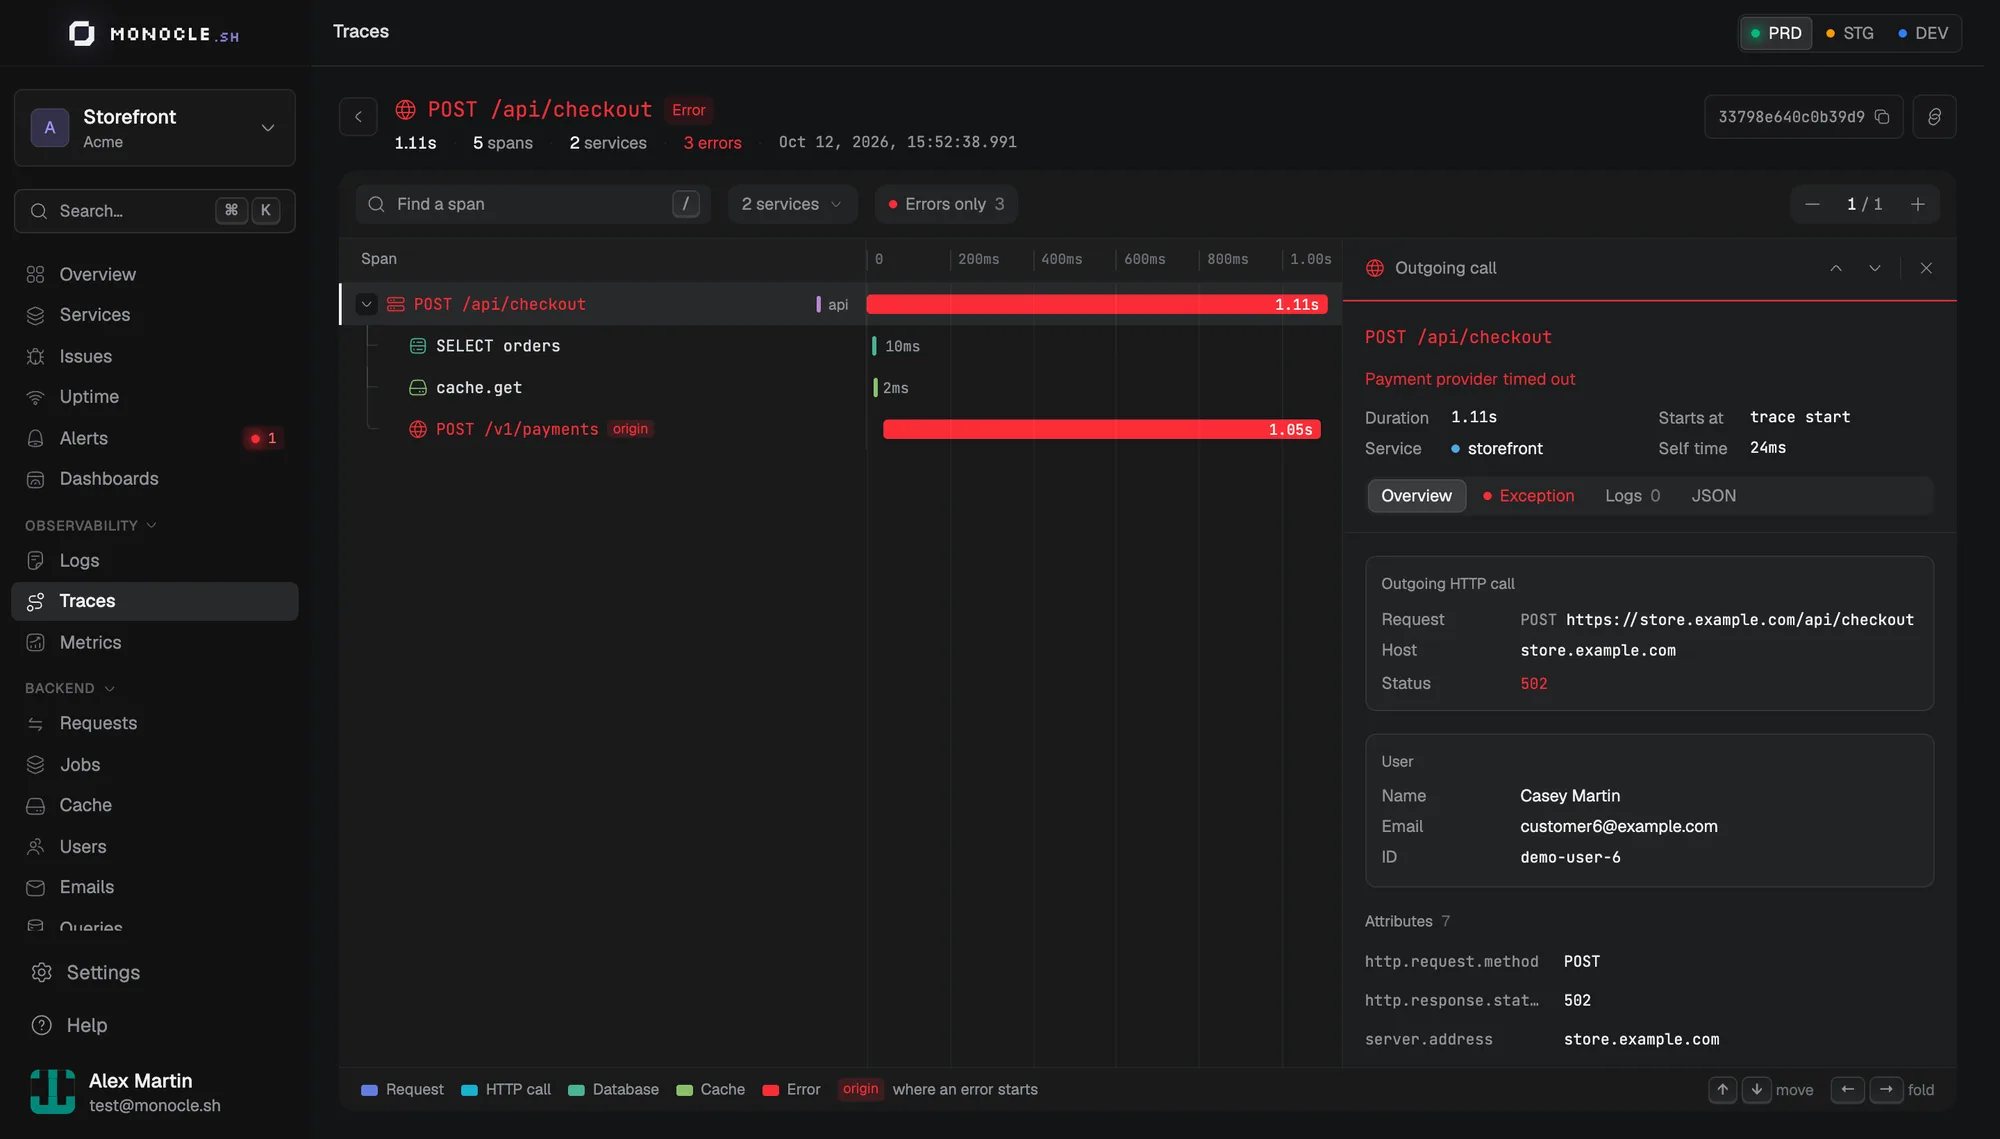
Once your frontend, your API, and your workers send to the same project, most traces cross a service boundary. Many things broke at that boundary. An API exception showed no route because the trace started with a browser fetch. A browser clock a few seconds off drew the API outside its own fetch. The same SQL in two services counted as one query. This release fixes all of them.
In the trace view, a call to another service is now two rows: the client span, and the server span nested under it. The span panel shows Called by and the Network time before and after the server, or Sent by and Queue wait for a message. Within one service, a client call and its server span still merge into one row.
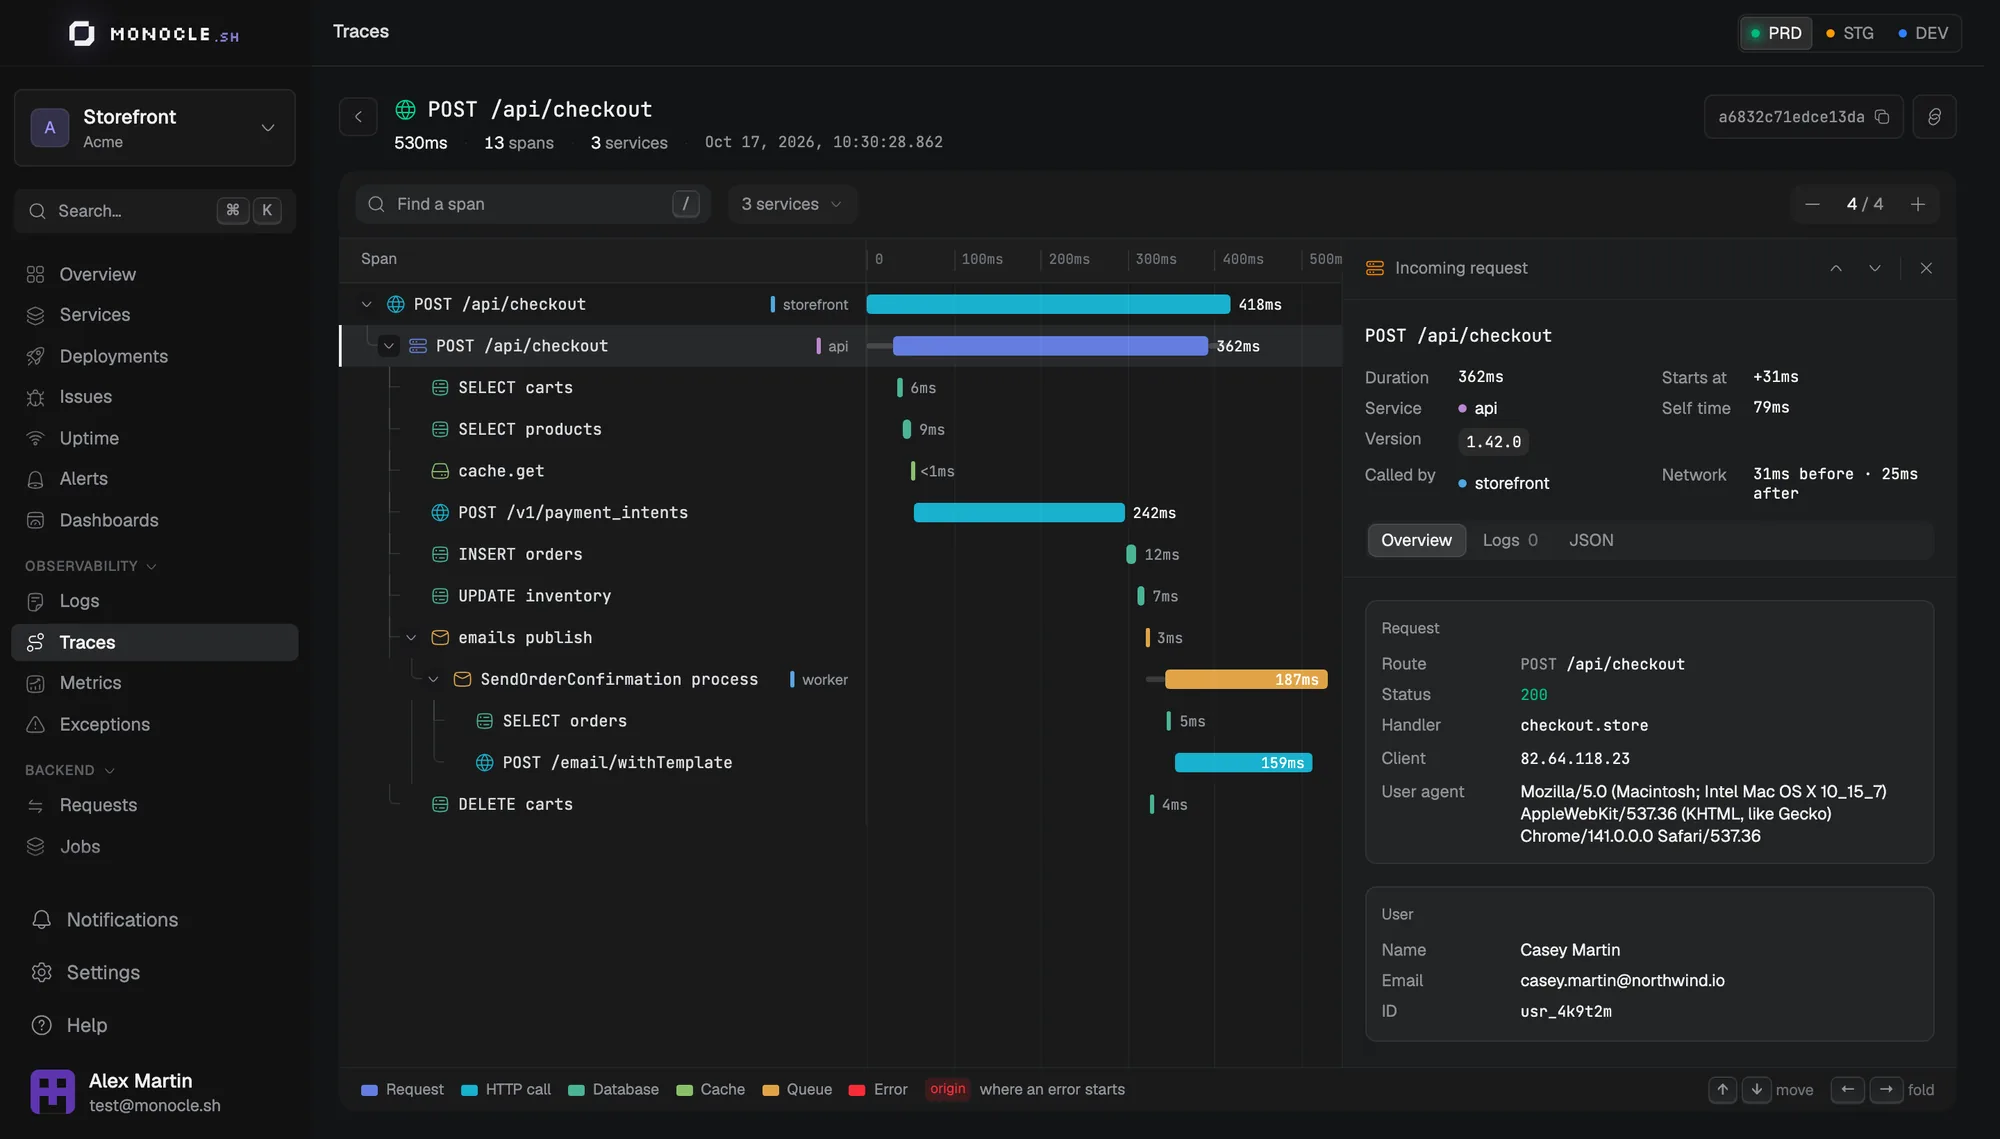
Each service has its own clock. When a server span starts before its caller sent the request, or ends after the caller got its answer, Monocle shifts it back inside the call. A clock icon marks the span where the correction starts, and its panel explains the shift. Durations never change.
Exceptions and queries now take their context from their own service. A query in a worker shows the worker's job, not the API route that started the trace. An exception occurrence lists the Other exceptions in this trace, with their service, route, and issue.
Endpoints, query patterns, and commands are counted per service. The same SELECT in two services is two patterns, and the queries table gets a Service column when you look at several services. On the External calls page, a domain that reaches one of your own services gets an Internal badge with the service name.
Smaller fixes: a trace that starts in the browser is no longer flagged as a background span, View all trace logs shows the logs of every service in the trace, and a command started from a job now shows up on the Commands page.
Issues replace exceptions
Before, Monocle grouped exceptions by type and message, and issues were tickets you created by hand. In practice that meant a long list of exceptions that nobody triaged.
The separate Exceptions page is gone. Everything now lives in Issues: errors from your frontend and backend are grouped automatically, with every occurrence attached to its issue. No more creating tickets by hand.
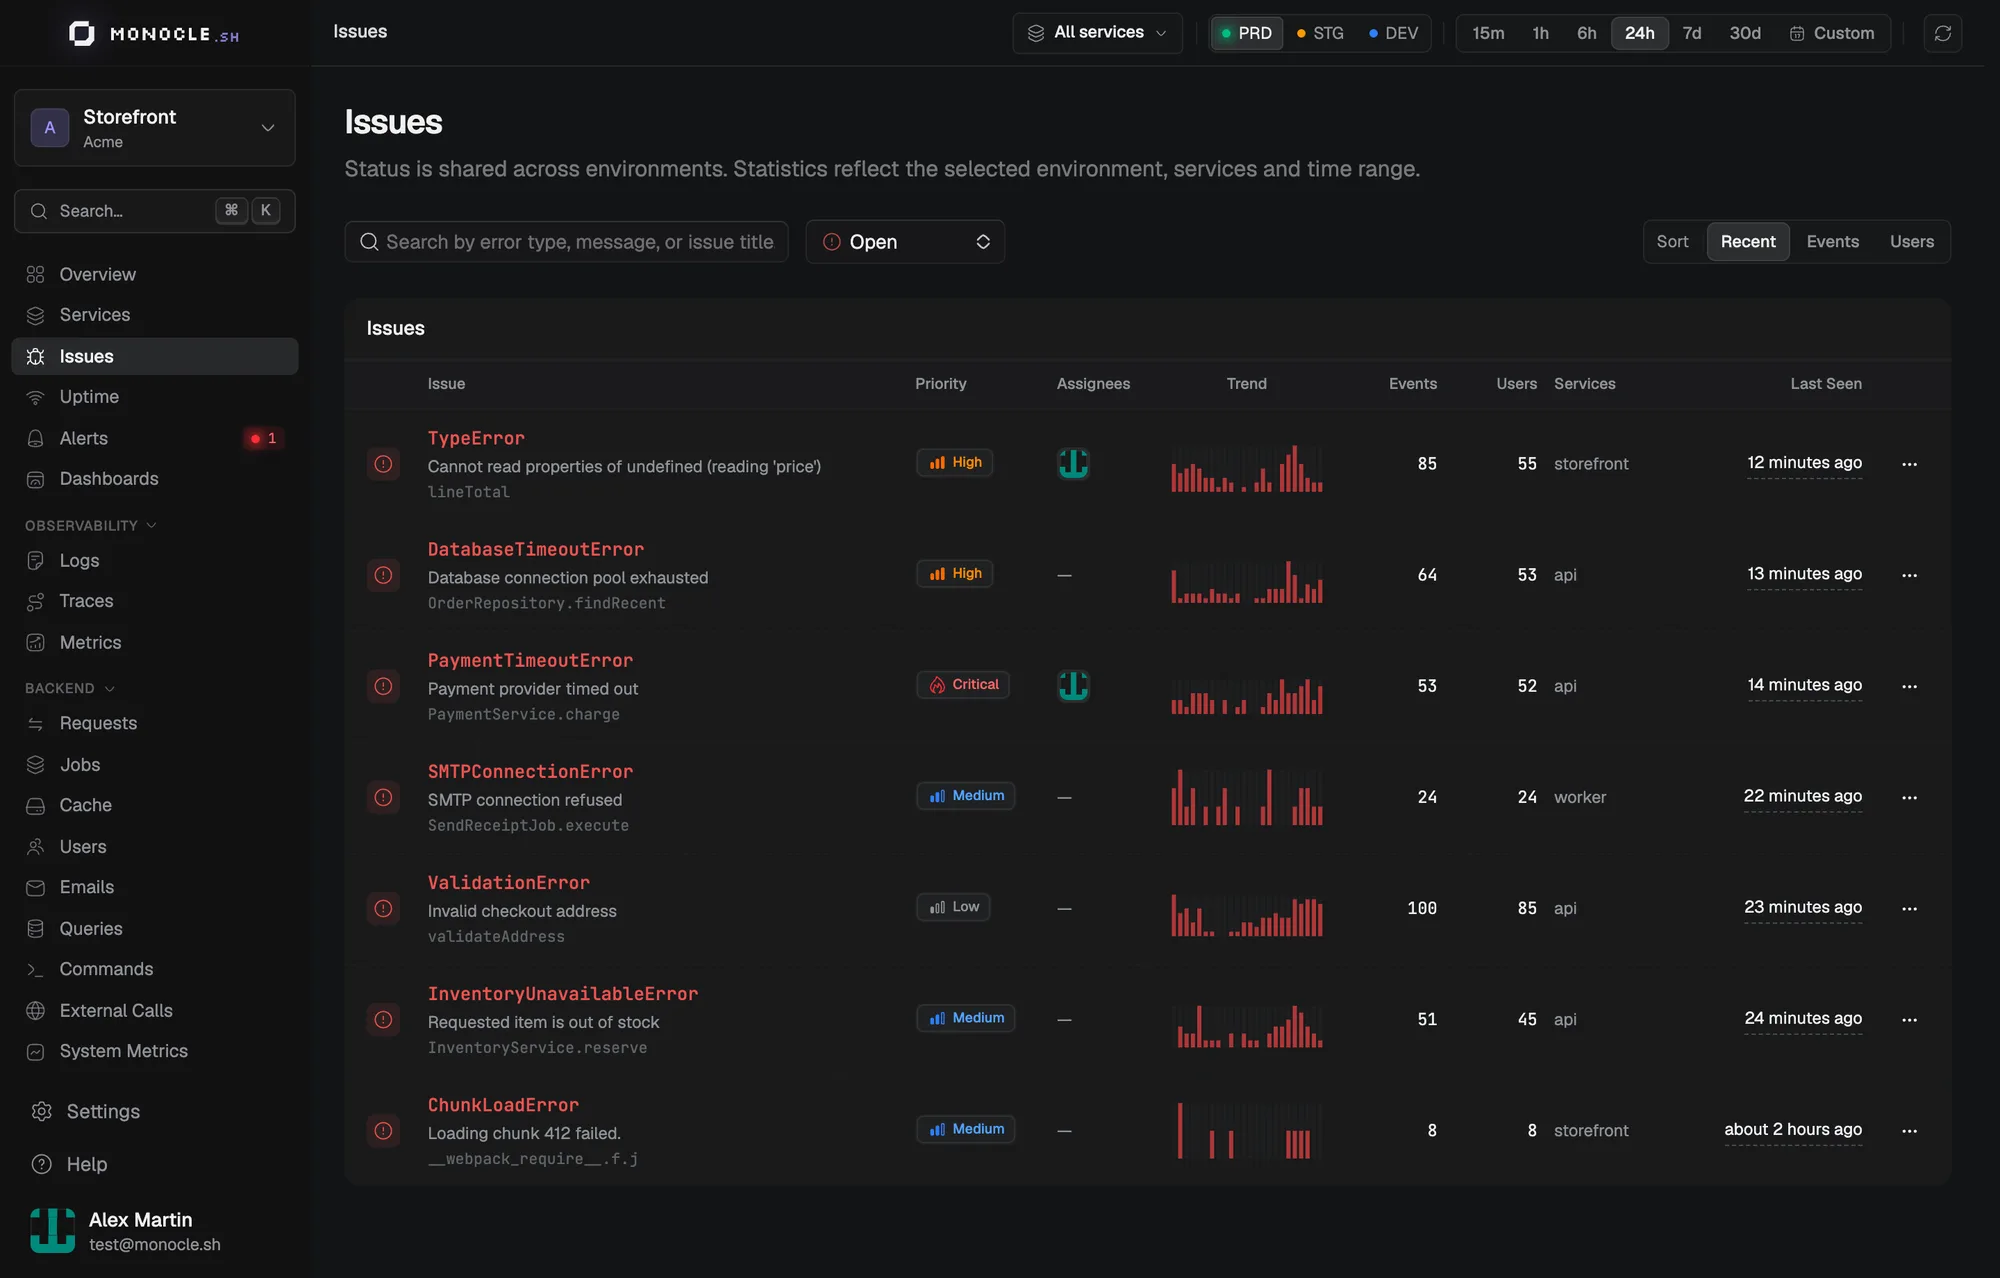
An issue is Open, Resolved, or Archived:
- If a resolved issue gets a new event, it reopens and is marked as a regression.
- You can archive an issue forever or for a while (1 hour, 1 day, 1 week, or 30 days). When the period ends, the issue reopens quietly.
- Archived issues never notify you.
The issue page brings together the occurrence timeline, affected services, and entry points. Browse individual occurrences to inspect their stack traces, linked traces, and context.
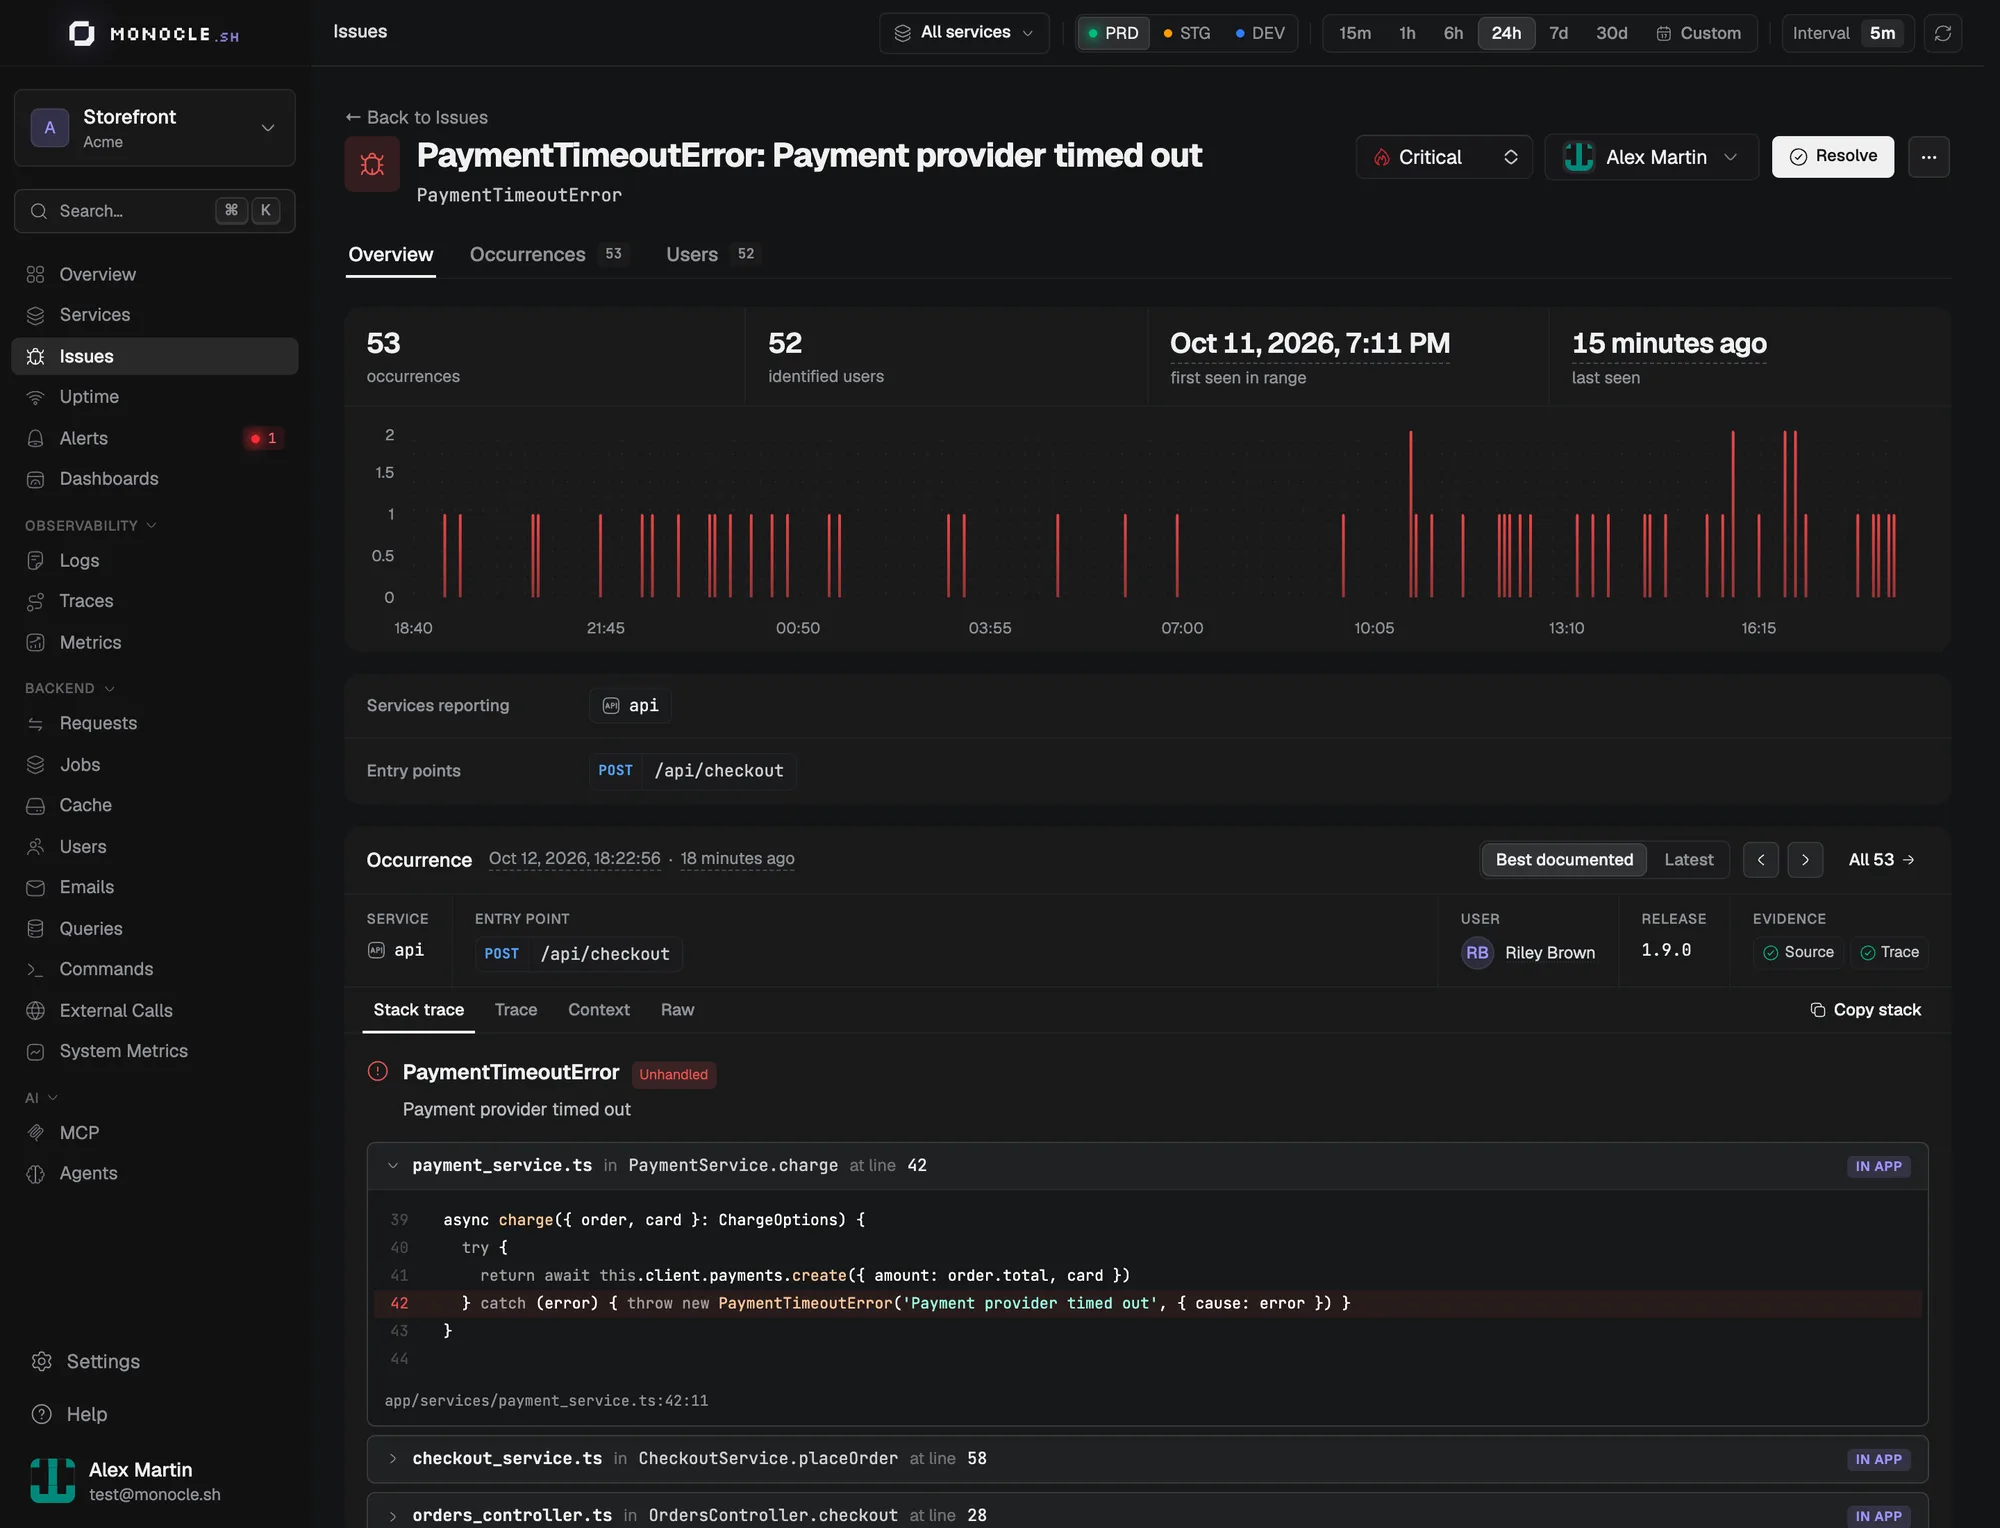
Issue status is shared across environments. Statistics follow the environment, services, and time range you have selected.
Notifications that don't flood you
When an issue is new or regressed, Monocle notifies you by email, Slack, Discord, or webhook.
Every project member gets the emails by default and can turn them off in their notification settings. For channels, Exception alerts in the project settings is a table of rules by service and environment. A more specific rule wins, so you can send payments errors to their own channel and mute staging entirely. Organization defaults sit in the last row, Everything else.
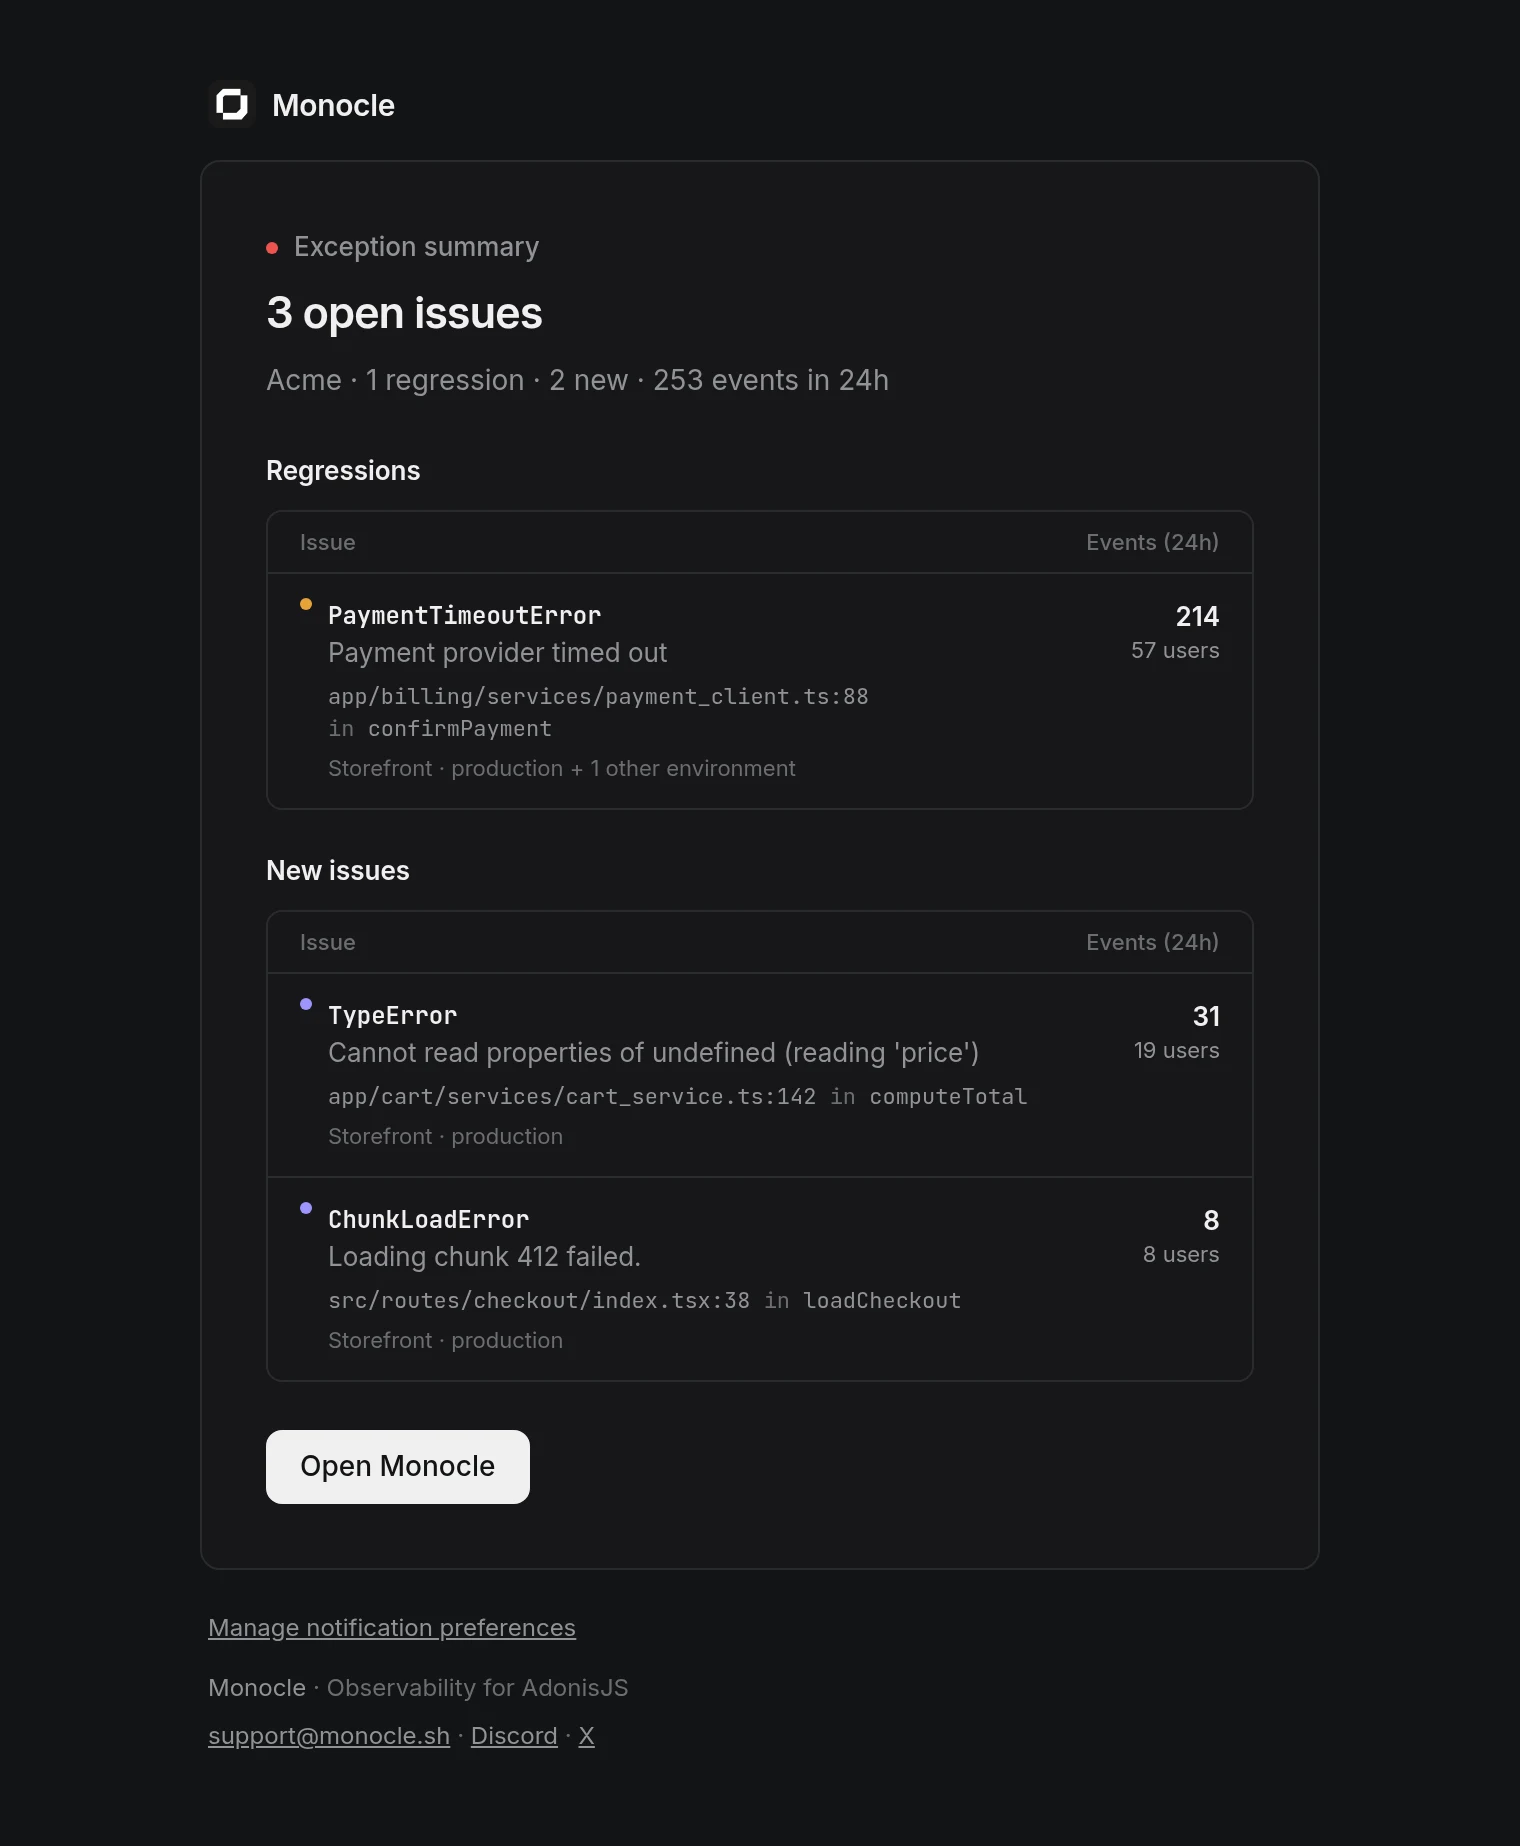
Issues you created by hand before this release still open from their links, but they no longer show up in the list.
Alerts, starting with your endpoints
Monocle has alerts now. They live on their own Alerts page, and the sidebar shows how many are firing right now. Endpoints are the first thing you can alert on: you get warned when an endpoint gets slow, starts failing, or goes quiet.
Open any endpoint, click Create alert, and pick what to watch:
- p50, p95, p99, or average latency
- Error rate (status 400 and above) or 5xx error rate
- Request rate, in requests per minute
Set a threshold, above or below, and a window of 5 to 30 minutes. Under Advanced, you choose how long the condition must hold before the alert fires, the minimum number of requests to evaluate, and whether no traffic at all counts as a breach. The defaults are sensible: p95 above your threshold, over 5 minutes, for 2 minutes in a row, with at least 20 requests.
The preview shows where your alert would have fired against recent traffic, so you can adjust the threshold before enabling it. Monocle can also suggest a threshold from that traffic.
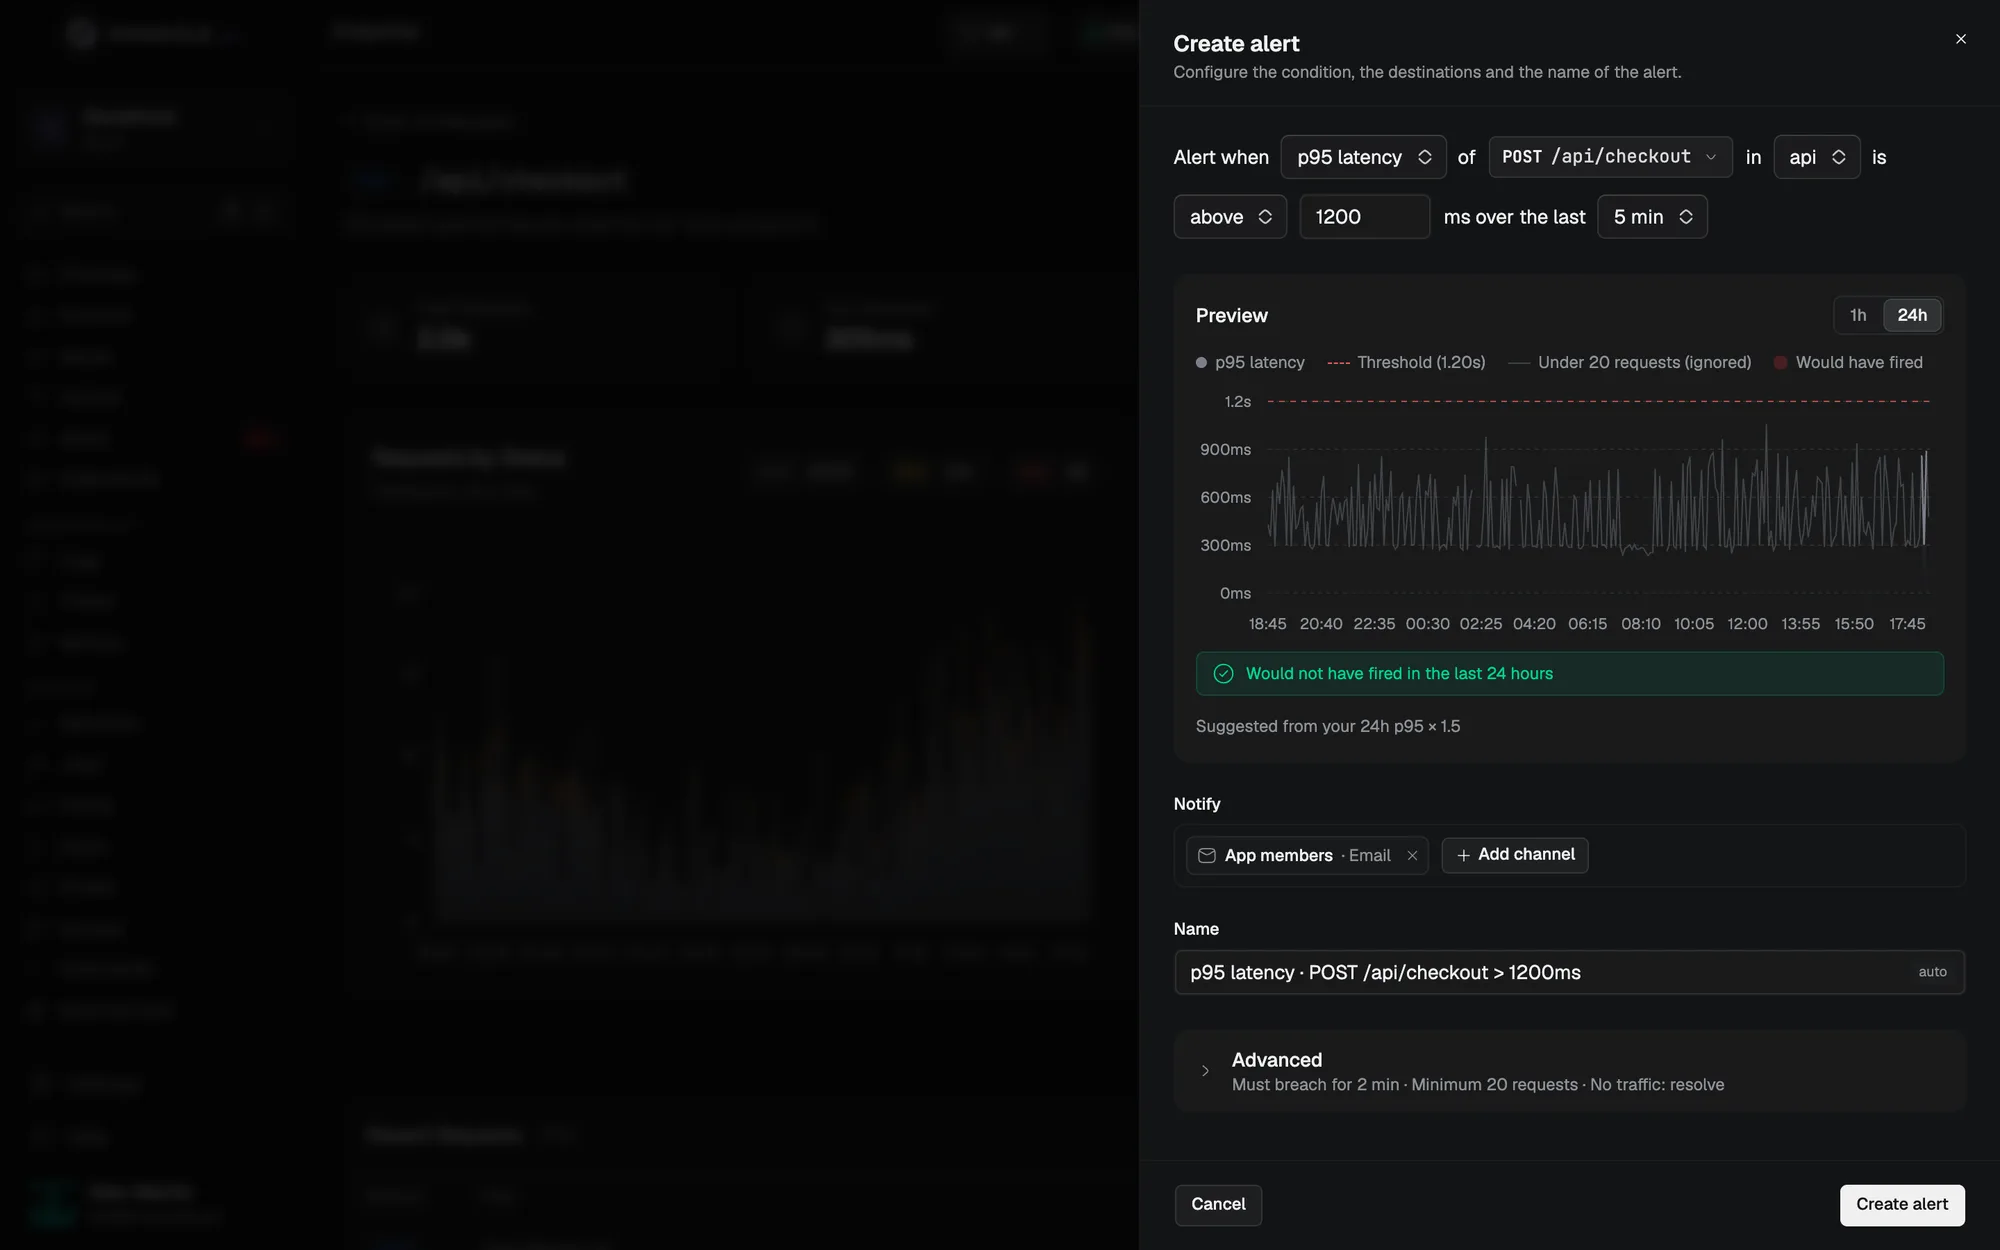
Alerts go to your Slack and Discord channels, and by email to the project members if you want. You get one notification when an alert fires and one when it resolves, with links to the endpoint and its slowest traces, and no reminders in between.
The Alerts page lists every rule with its trend. Each rule has its own page with the metric history and its past incidents, and you can pause it during a planned migration.
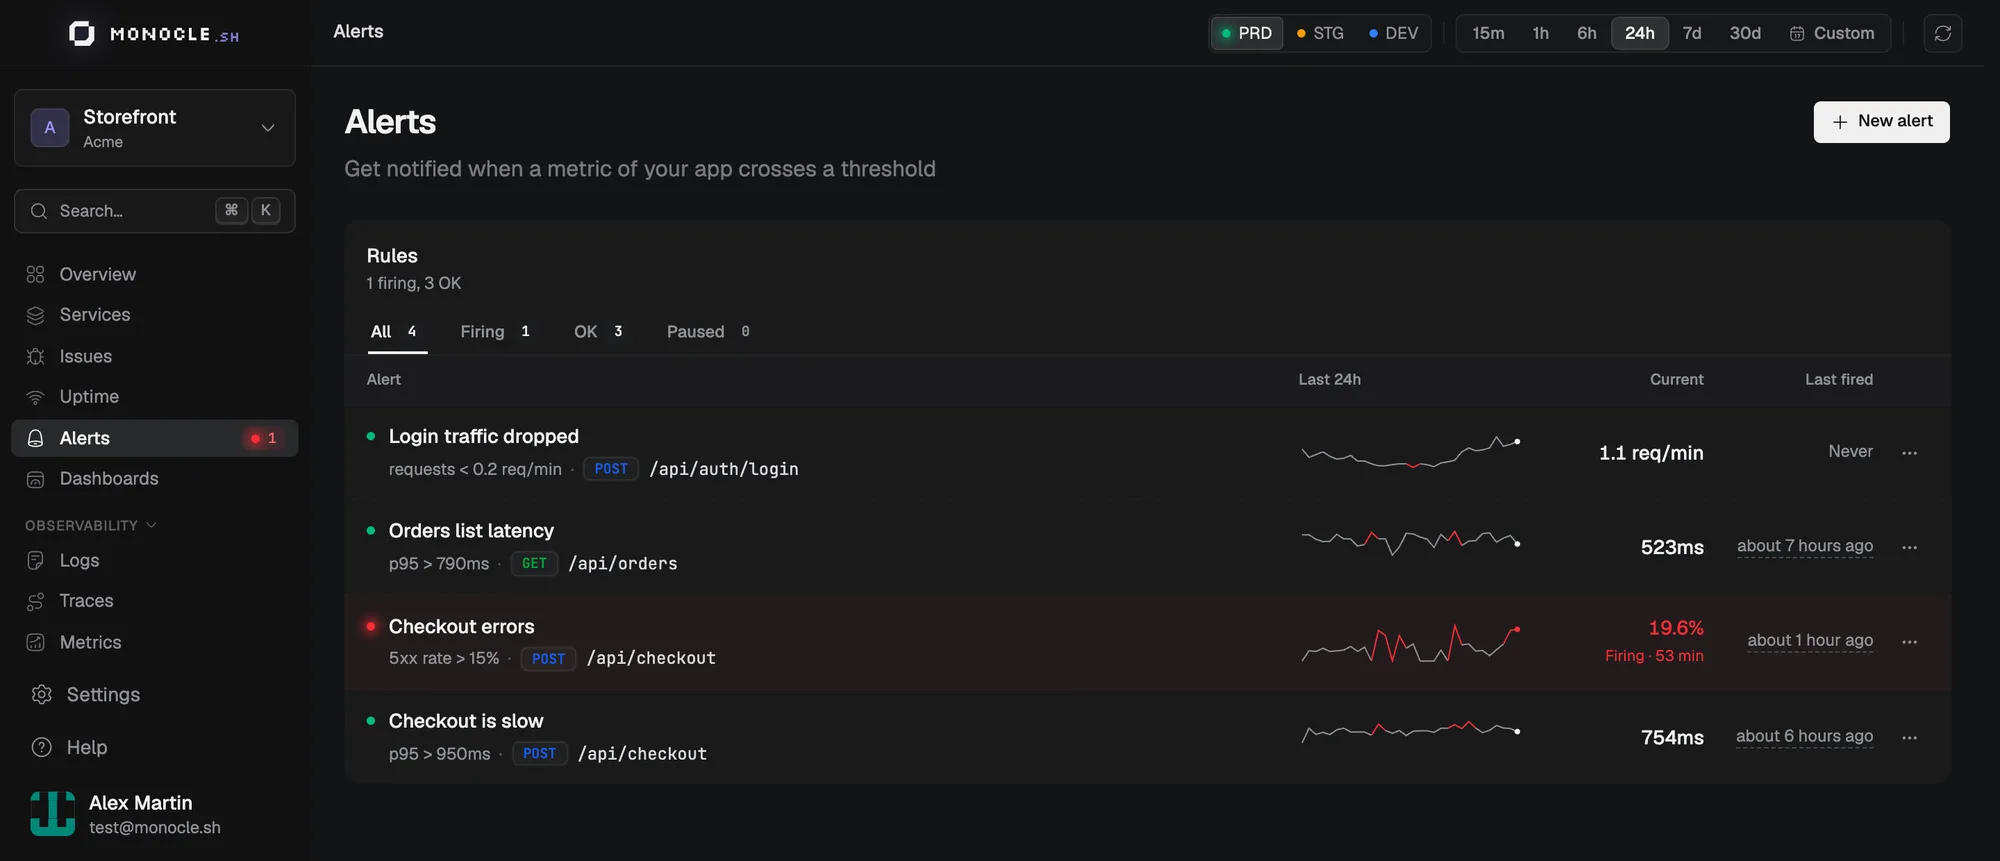
Notification channels
Slack and Discord webhooks used to be two fields in your organization settings. Now they are notification channels: you add one, give it a name, send a test message, and reuse it everywhere. Uptime, exceptions, and endpoint alerts all pick from the same list.
Next to Slack and Discord, a Webhook channel posts JSON to any public HTTPS endpoint: alerts firing and resolved, monitors down and recovered, and exception summaries. Requests are signed with Standard Webhooks, so any of its libraries can verify them. Each channel has its own signing secret, which admins can reveal and rotate.
You can mark a channel as the default for Uptime monitors, for exceptions, or both, and limit it to production environments. New monitors and projects then notify the right place without extra setup.
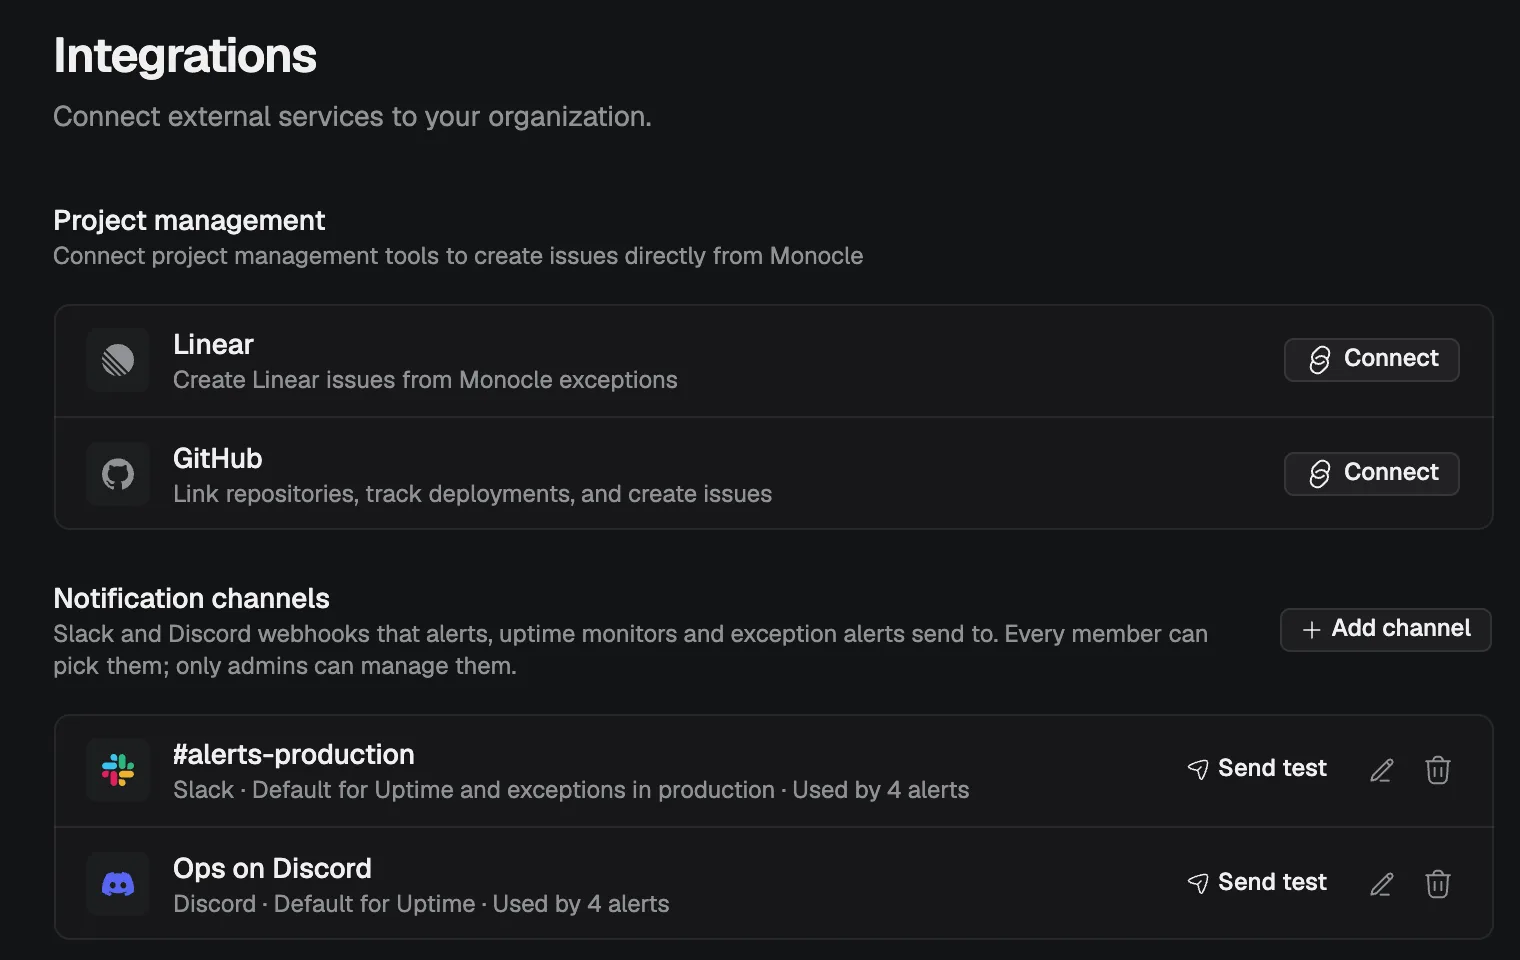
Your existing webhooks were moved into channels automatically. If a webhook URL was invalid, it was skipped, so check your channels once.
Email is now a personal choice. Each member decides which emails they get: Uptime alerts, endpoint alerts, weekly recaps, and exception summaries.
Uptime, reworked
You can now monitor several resources per environment: your API, your dashboard, a third-party dependency. Each resource has its own page with availability, response times, failed checks, and the response that came back. When a check hits one of your instrumented endpoints, Open trace takes you to the trace of that exact check.
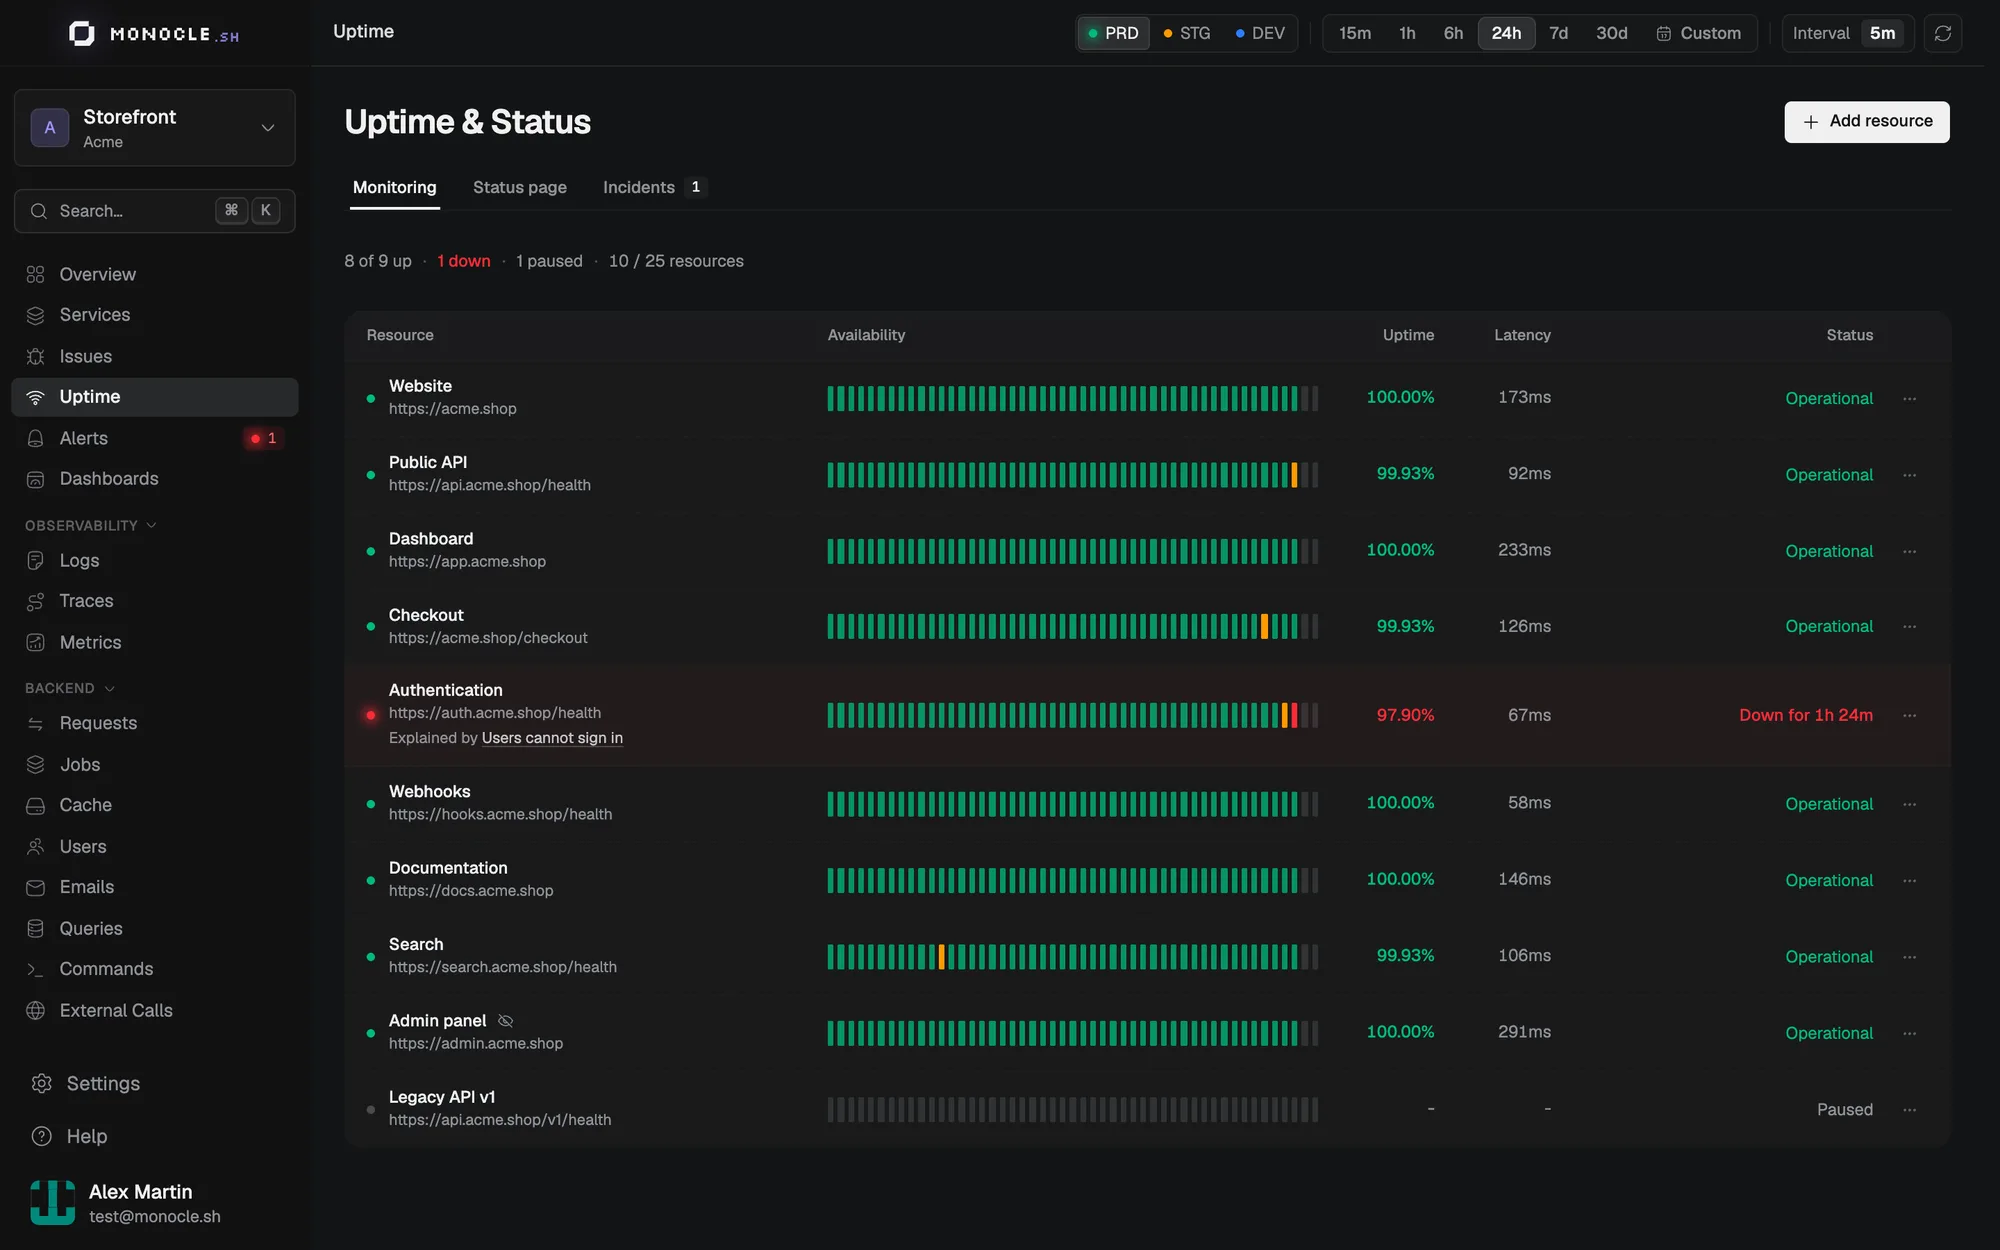
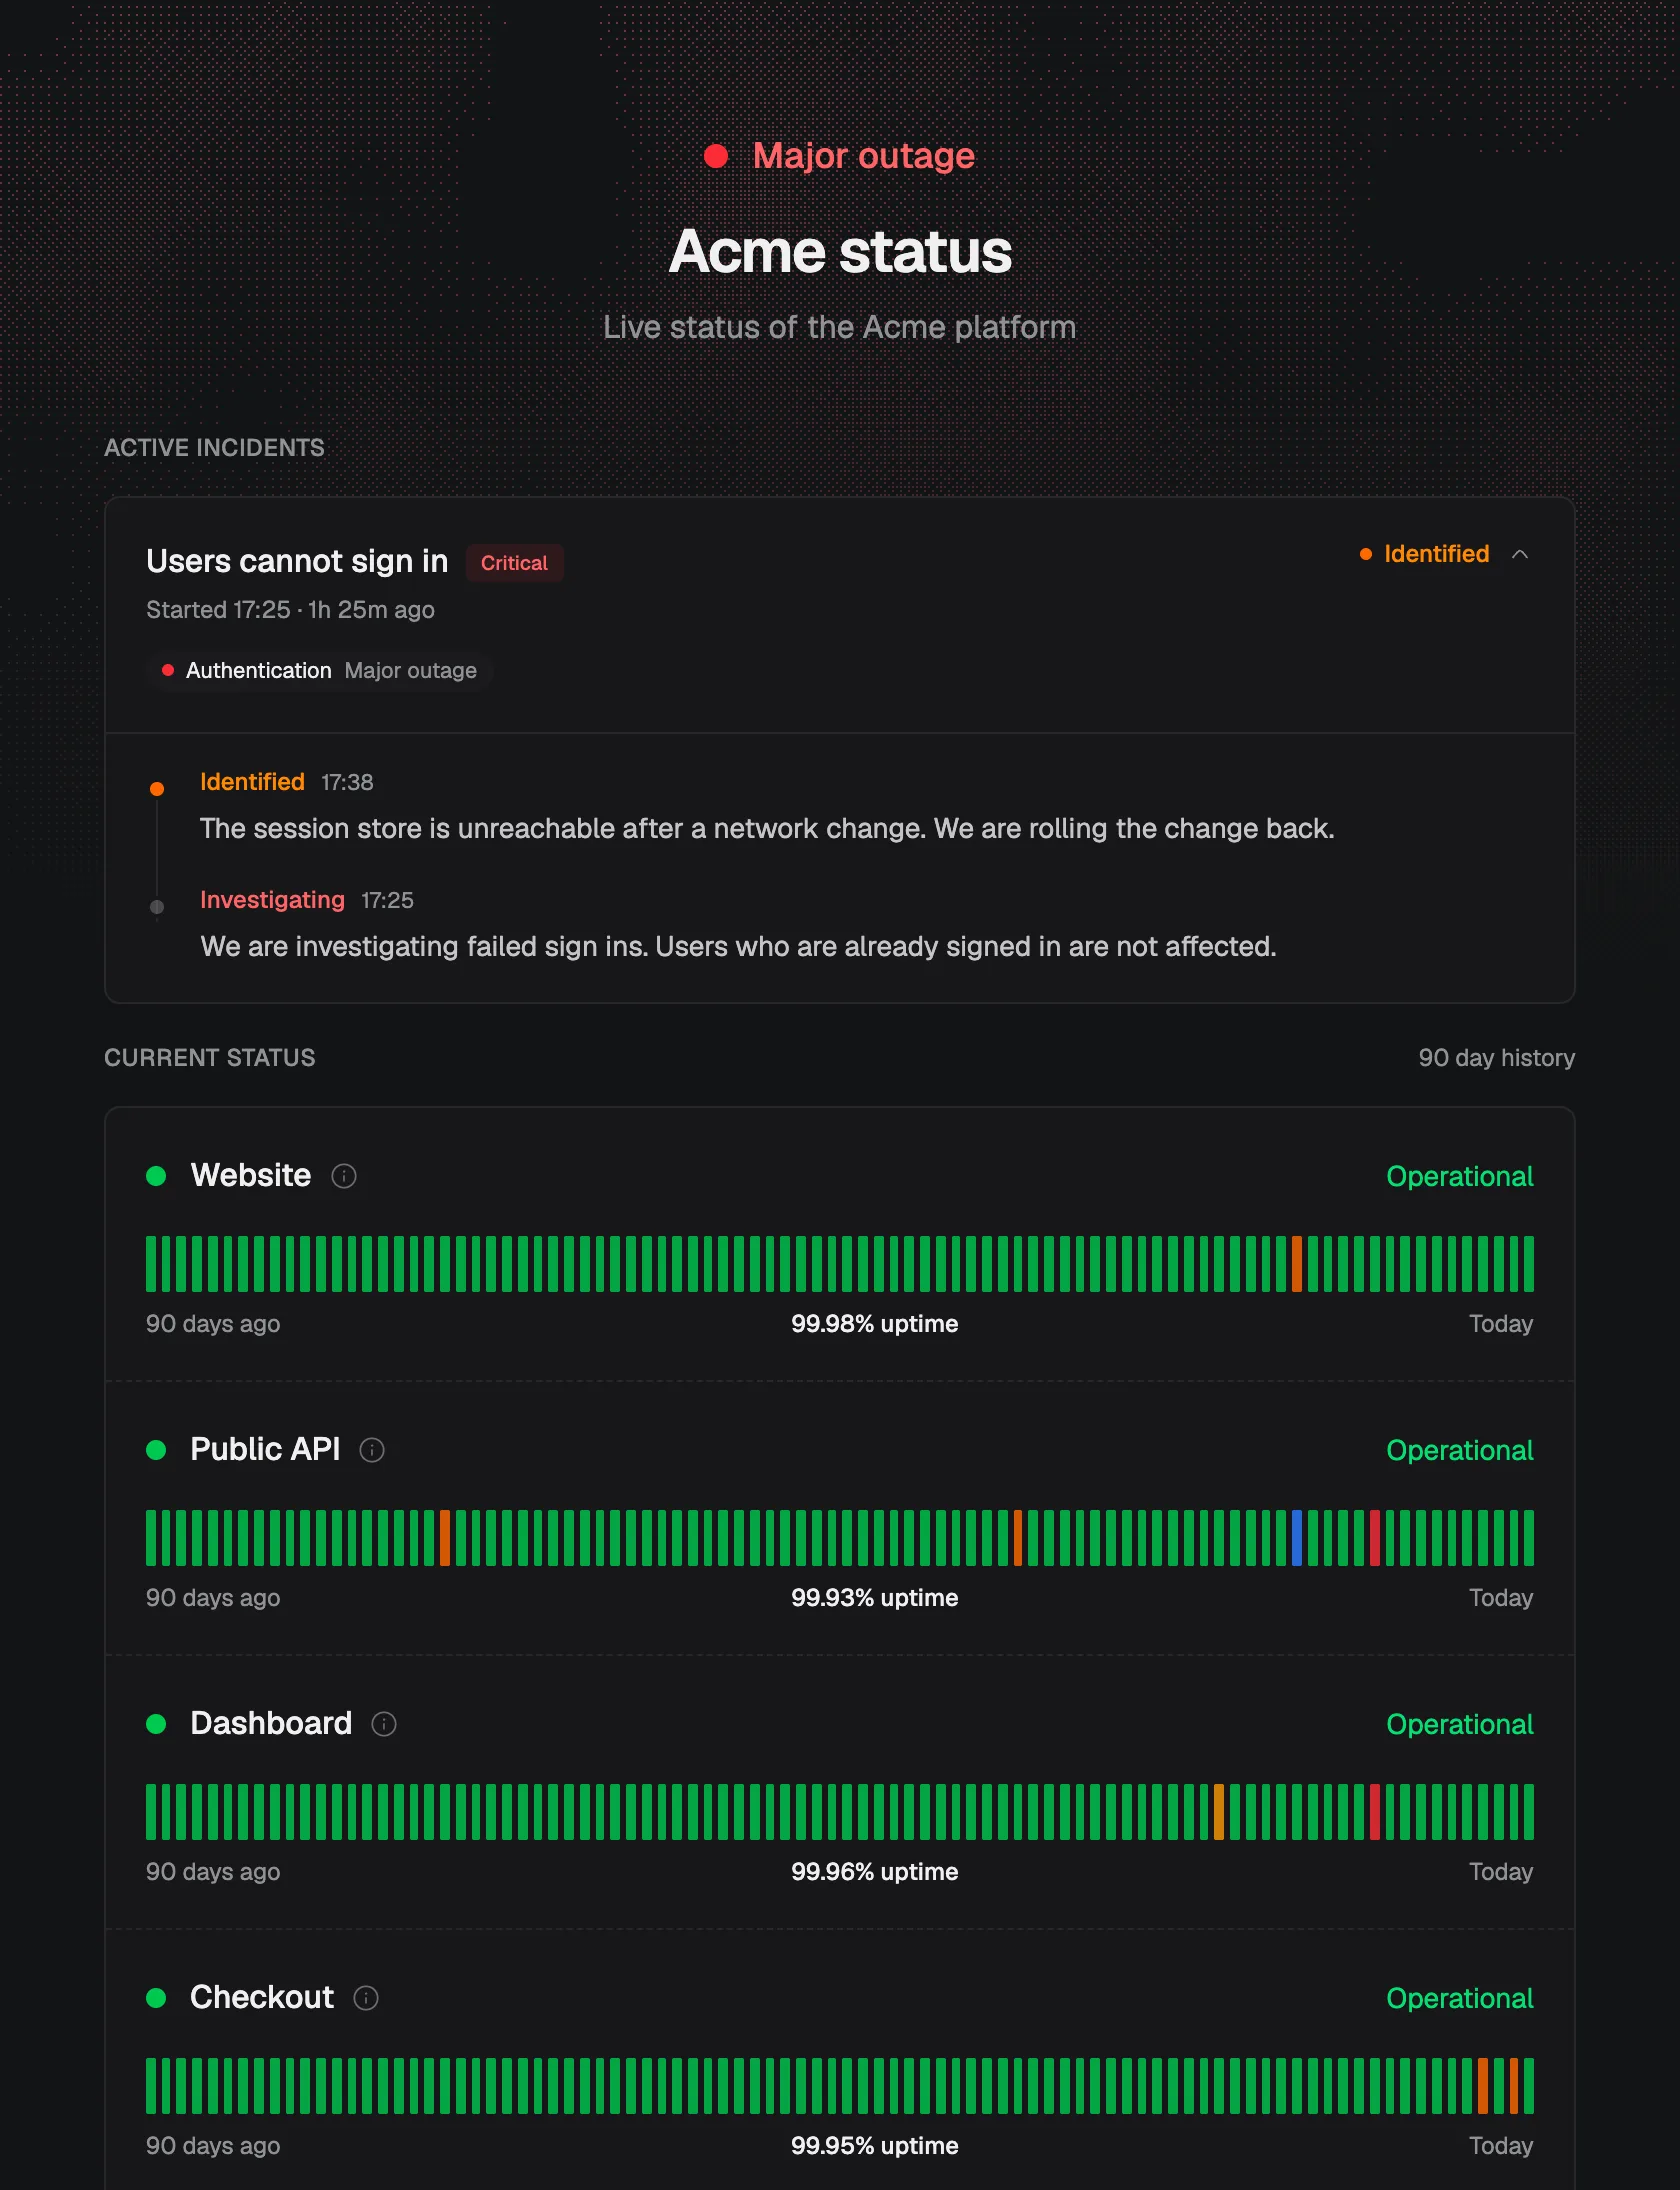
Incidents are new. When Monocle detects an outage, you can link it to an incident, mark which resources are affected and how badly, and post updates as you go. You can also schedule maintenance windows. Outages never publish an incident by themselves: you decide what your customers read.
Deployments, detected from your telemetry
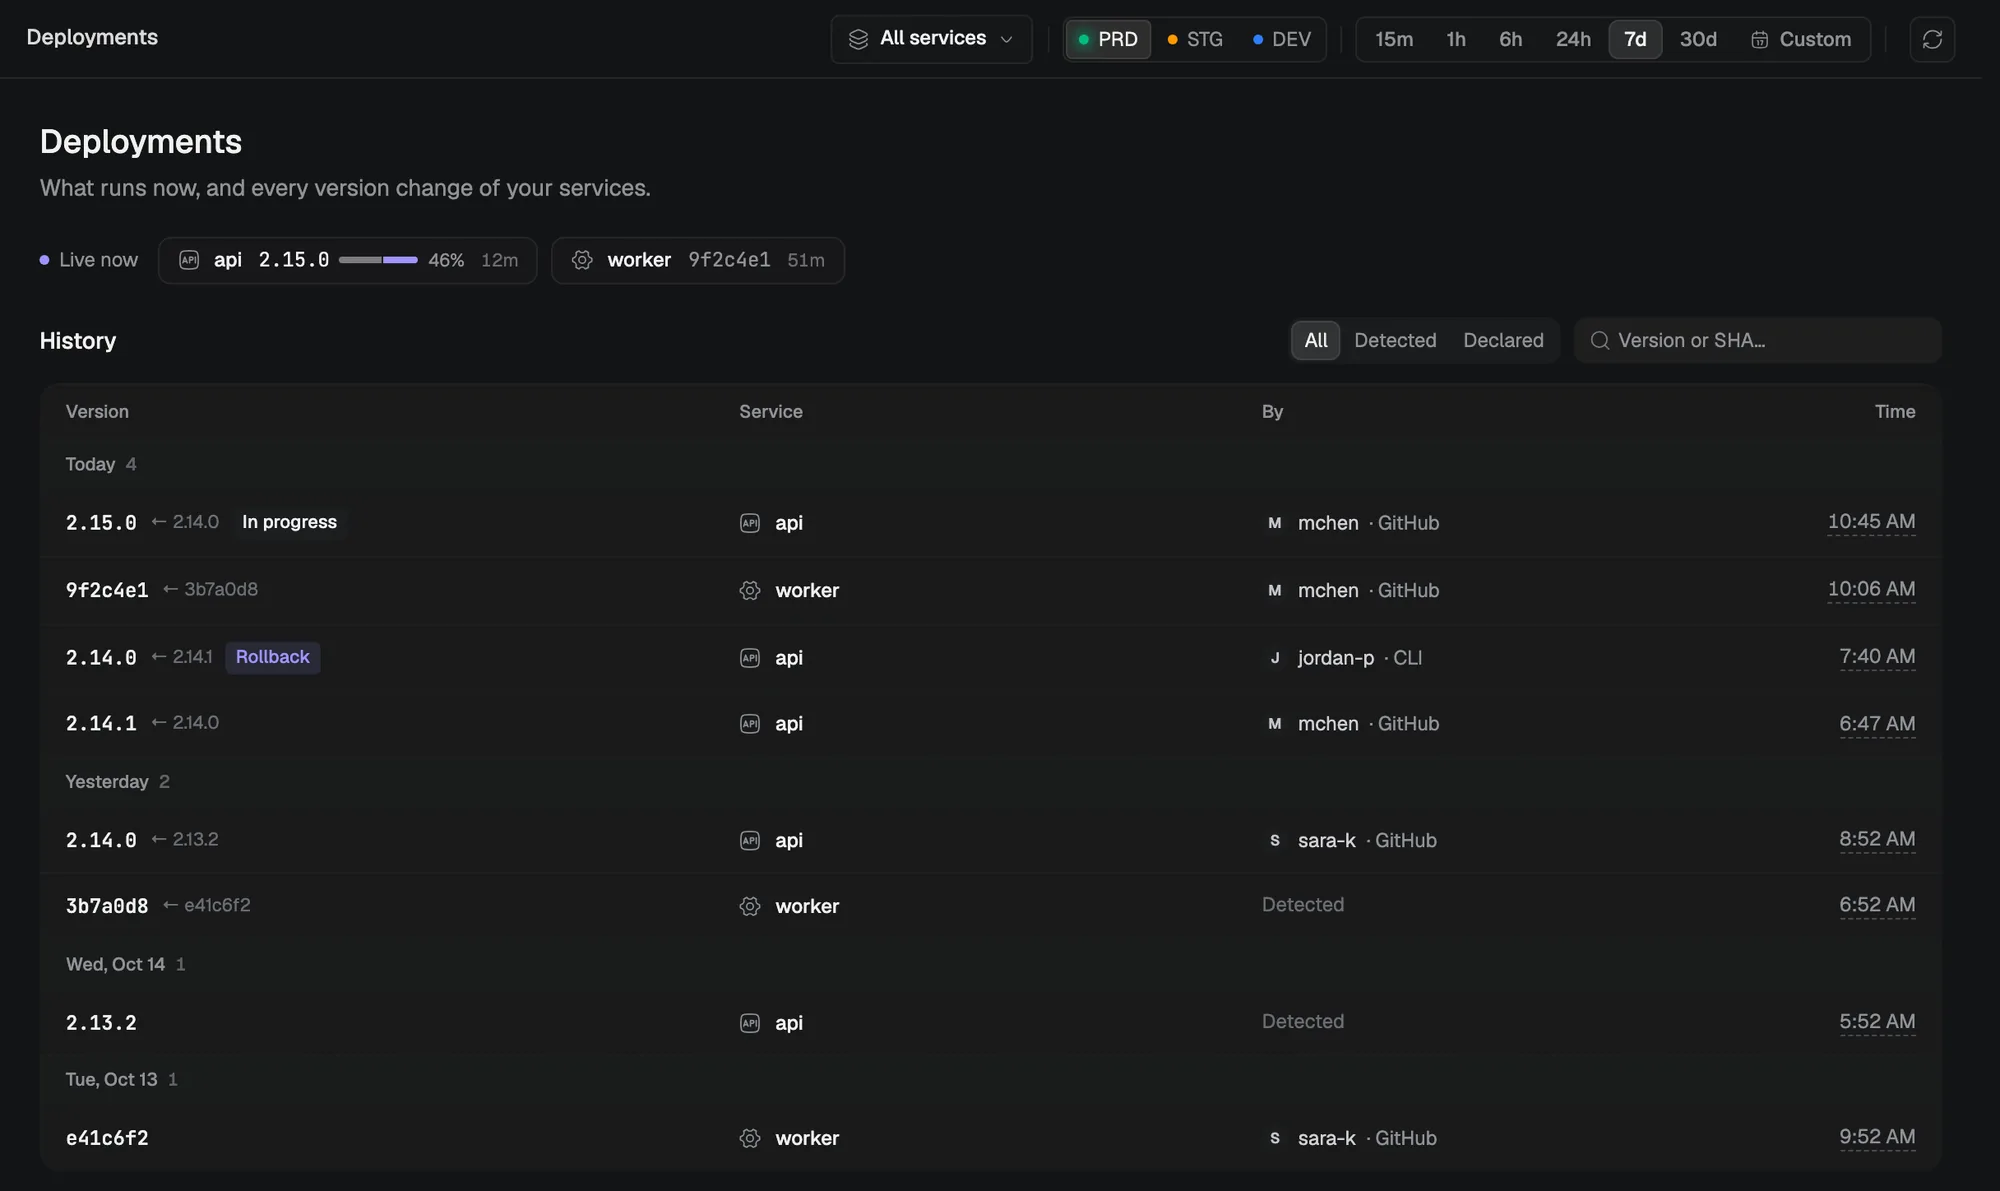
When a chart moves, the first question is whether it started with a deploy. Monocle now records a deployment each time a new version of a service starts running in an environment.
You don't have to declare anything for this. Monocle reads service.version on the requests and jobs of each service. When a new version shows up, it records a detected deployment. A rolling deploy or a canary doesn't create extra deployments. A rollback does. When an older version takes most of the traffic back, Monocle records a new deployment. A few requests from a browser tab opened before the deploy don't count.
A detected time is when Monocle first saw the version, not when your deploy finished. To add the exact time, the status, the author, and the CI run, declare the deployment in one of three ways:
- Run
monocle deployat the end of your CI job, with a deploy key from Project settings. - Call the Deployments API.
- Connect the GitHub integration. GitHub Actions jobs that target an
environmentcreate GitHub deployments, and so do Vercel, Render, and Railway. Monocle records them without a CI step.
monocle deploy --service api --environment productionA declaration and a detection of the same version merge into one deployment.
Deployments appear as markers under the charts of the overview, requests, endpoints, issues, logs, and traces. A hollow marker is detected, a filled one is declared. The Deployments page shows the versions each service runs right now, with their share of traffic during a rollout, then the full history. Issues, logs, and spans carry a version badge that opens the deployment of that version.
Your agent knows about them too. The MCP server has list_deployments and get_deployment, and both say whether a deployment was detected or declared, so your agent doesn't present a first sighting as a deploy time.
To get started, send a version with your telemetry. Recent AdonisJS and Effect agents detect it automatically, and the Vite plugin adds it to browser builds. See the deployments setup guide for details.
Almost every page, redesigned
The app has a new design in both light and dark mode, with updated navigation, tables, and page layouts.
This wasn't only a new coat of paint. Most pages were rebuilt around how you actually use them, and they gained features on the way.
Overview
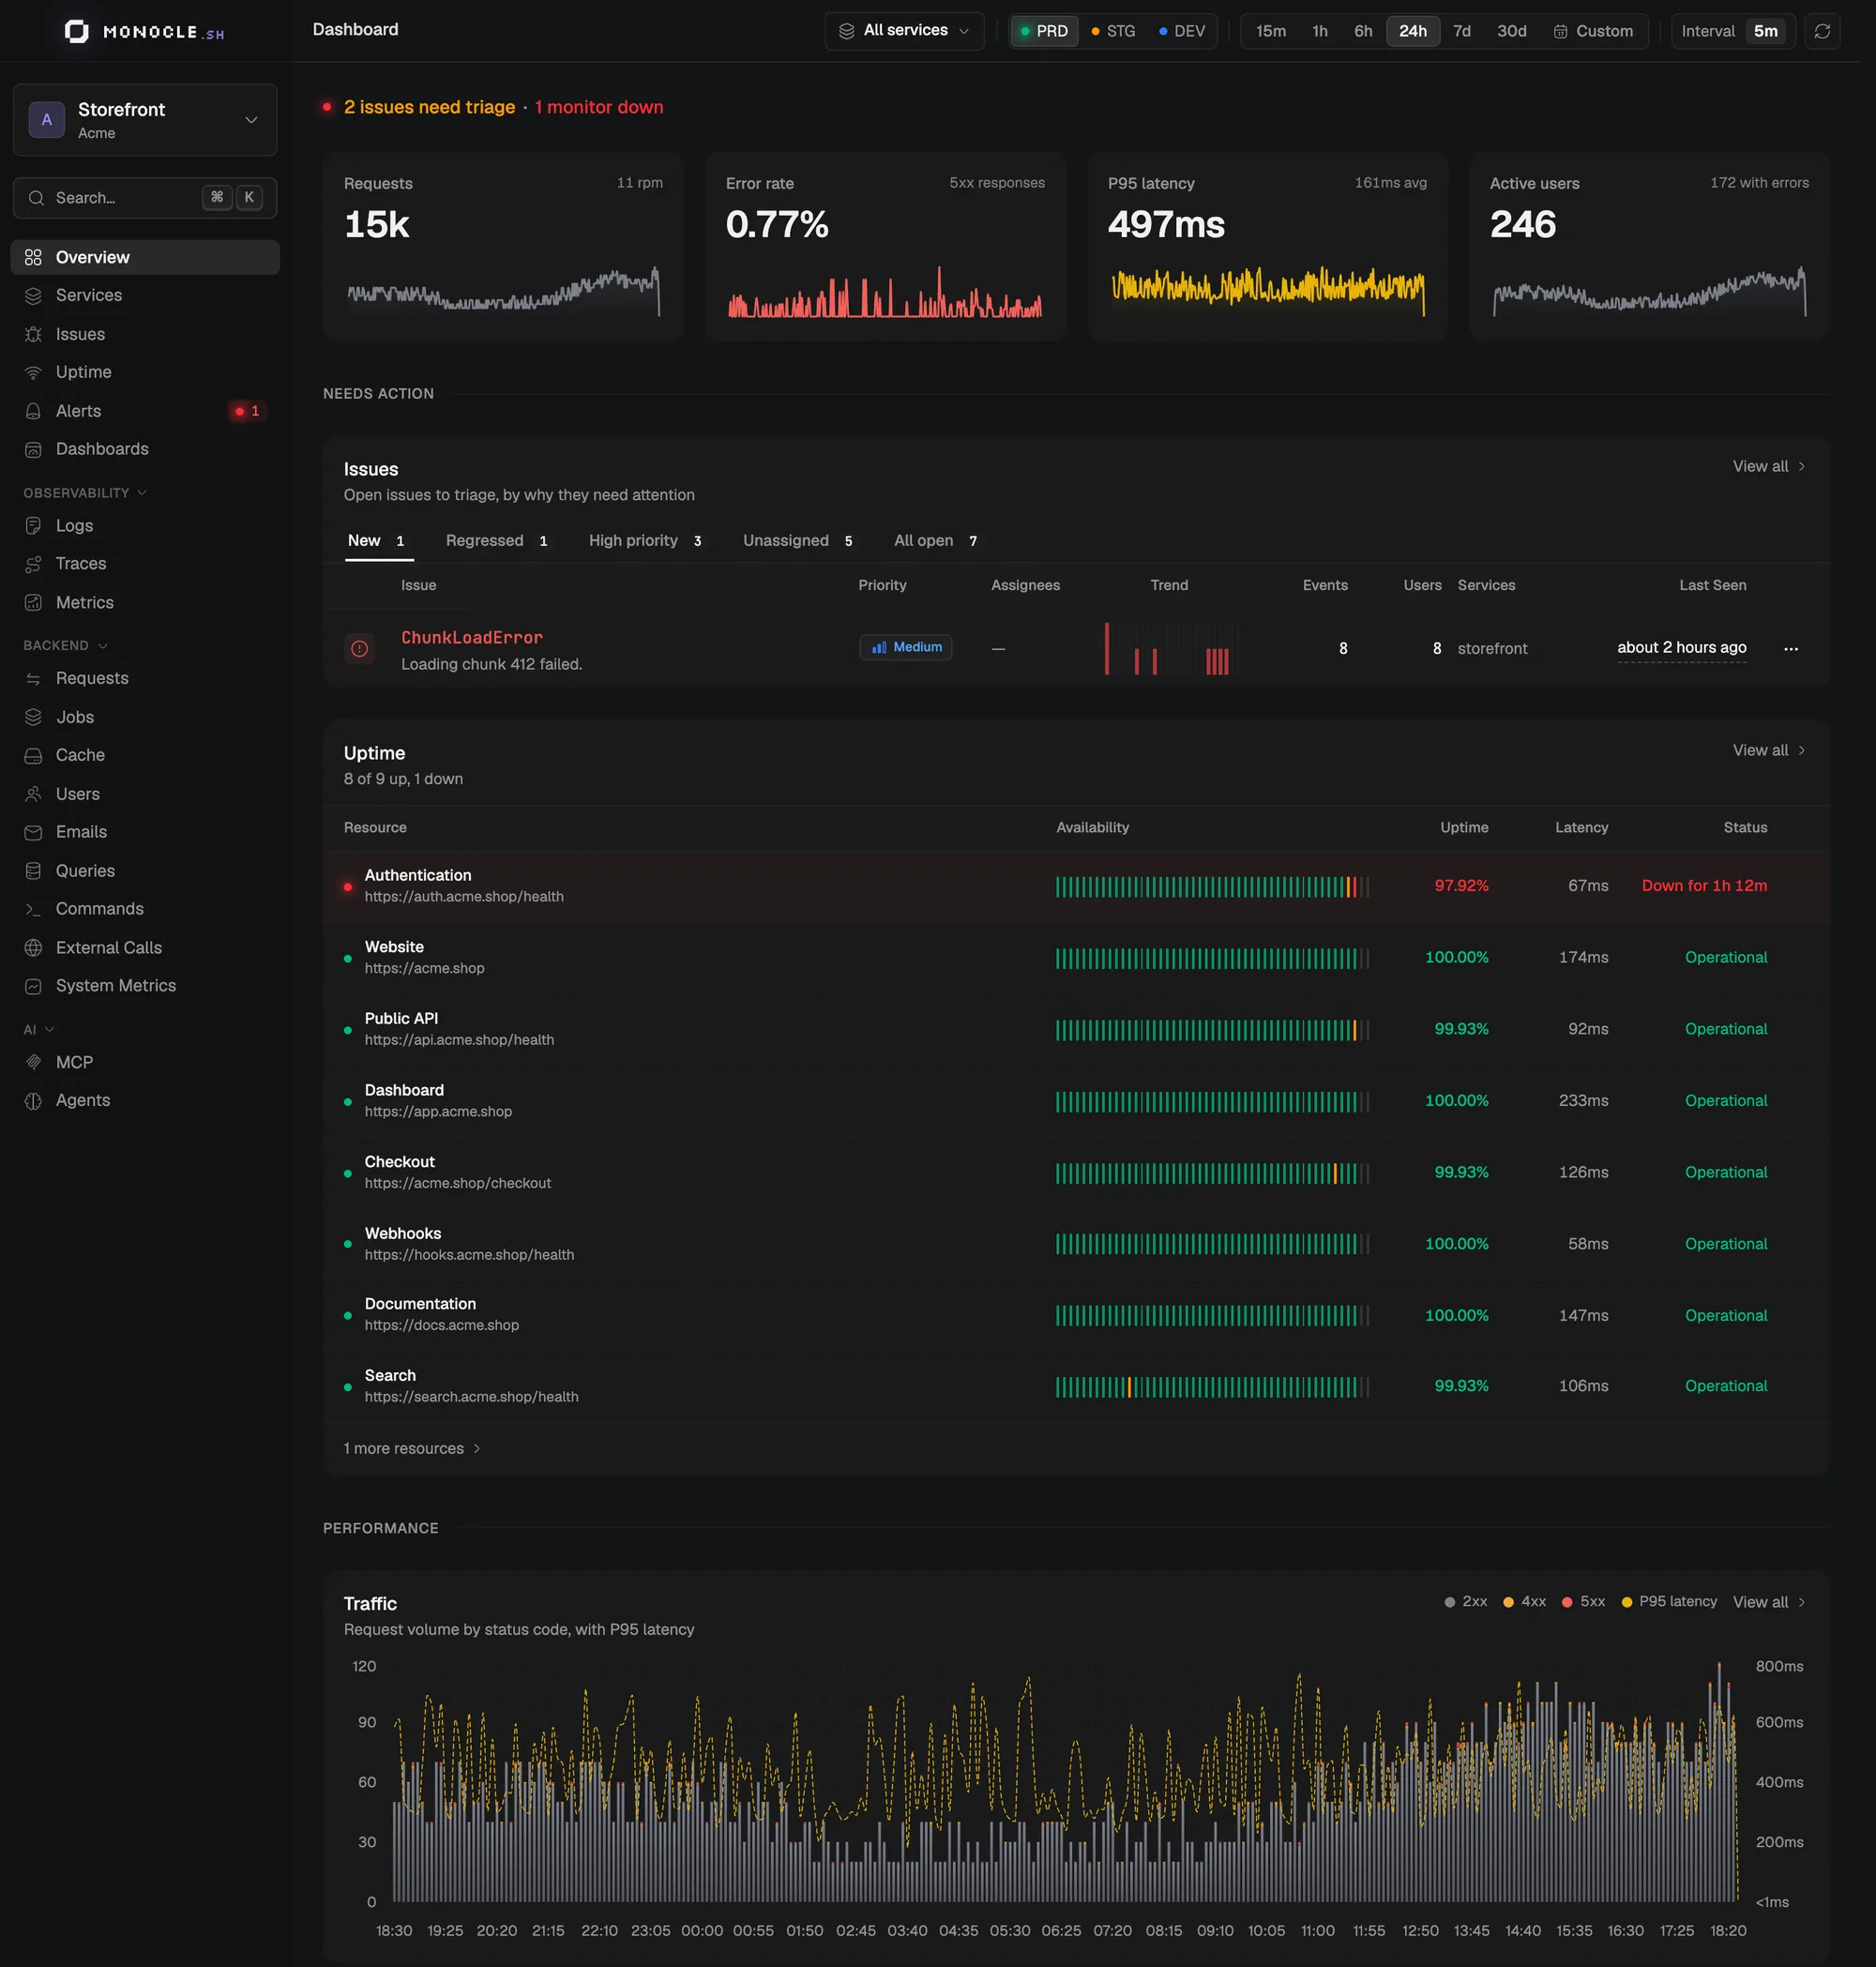
The overview now reads top to bottom. A status line tells you what's wrong right now: issues to triage, monitors down, server error rate. Below it, cards show requests, 5xx rate, P95, and active users, with their trends.
Then comes what needs action. The issues table has New, Regressed, High priority, Unassigned, and All open tabs, and the Uptime table appears when the environment has monitors. Performance comes last: traffic with a P95 line, every service with its throughput, error rate, and P95, and hotspots for endpoints, queries, jobs, and external calls.
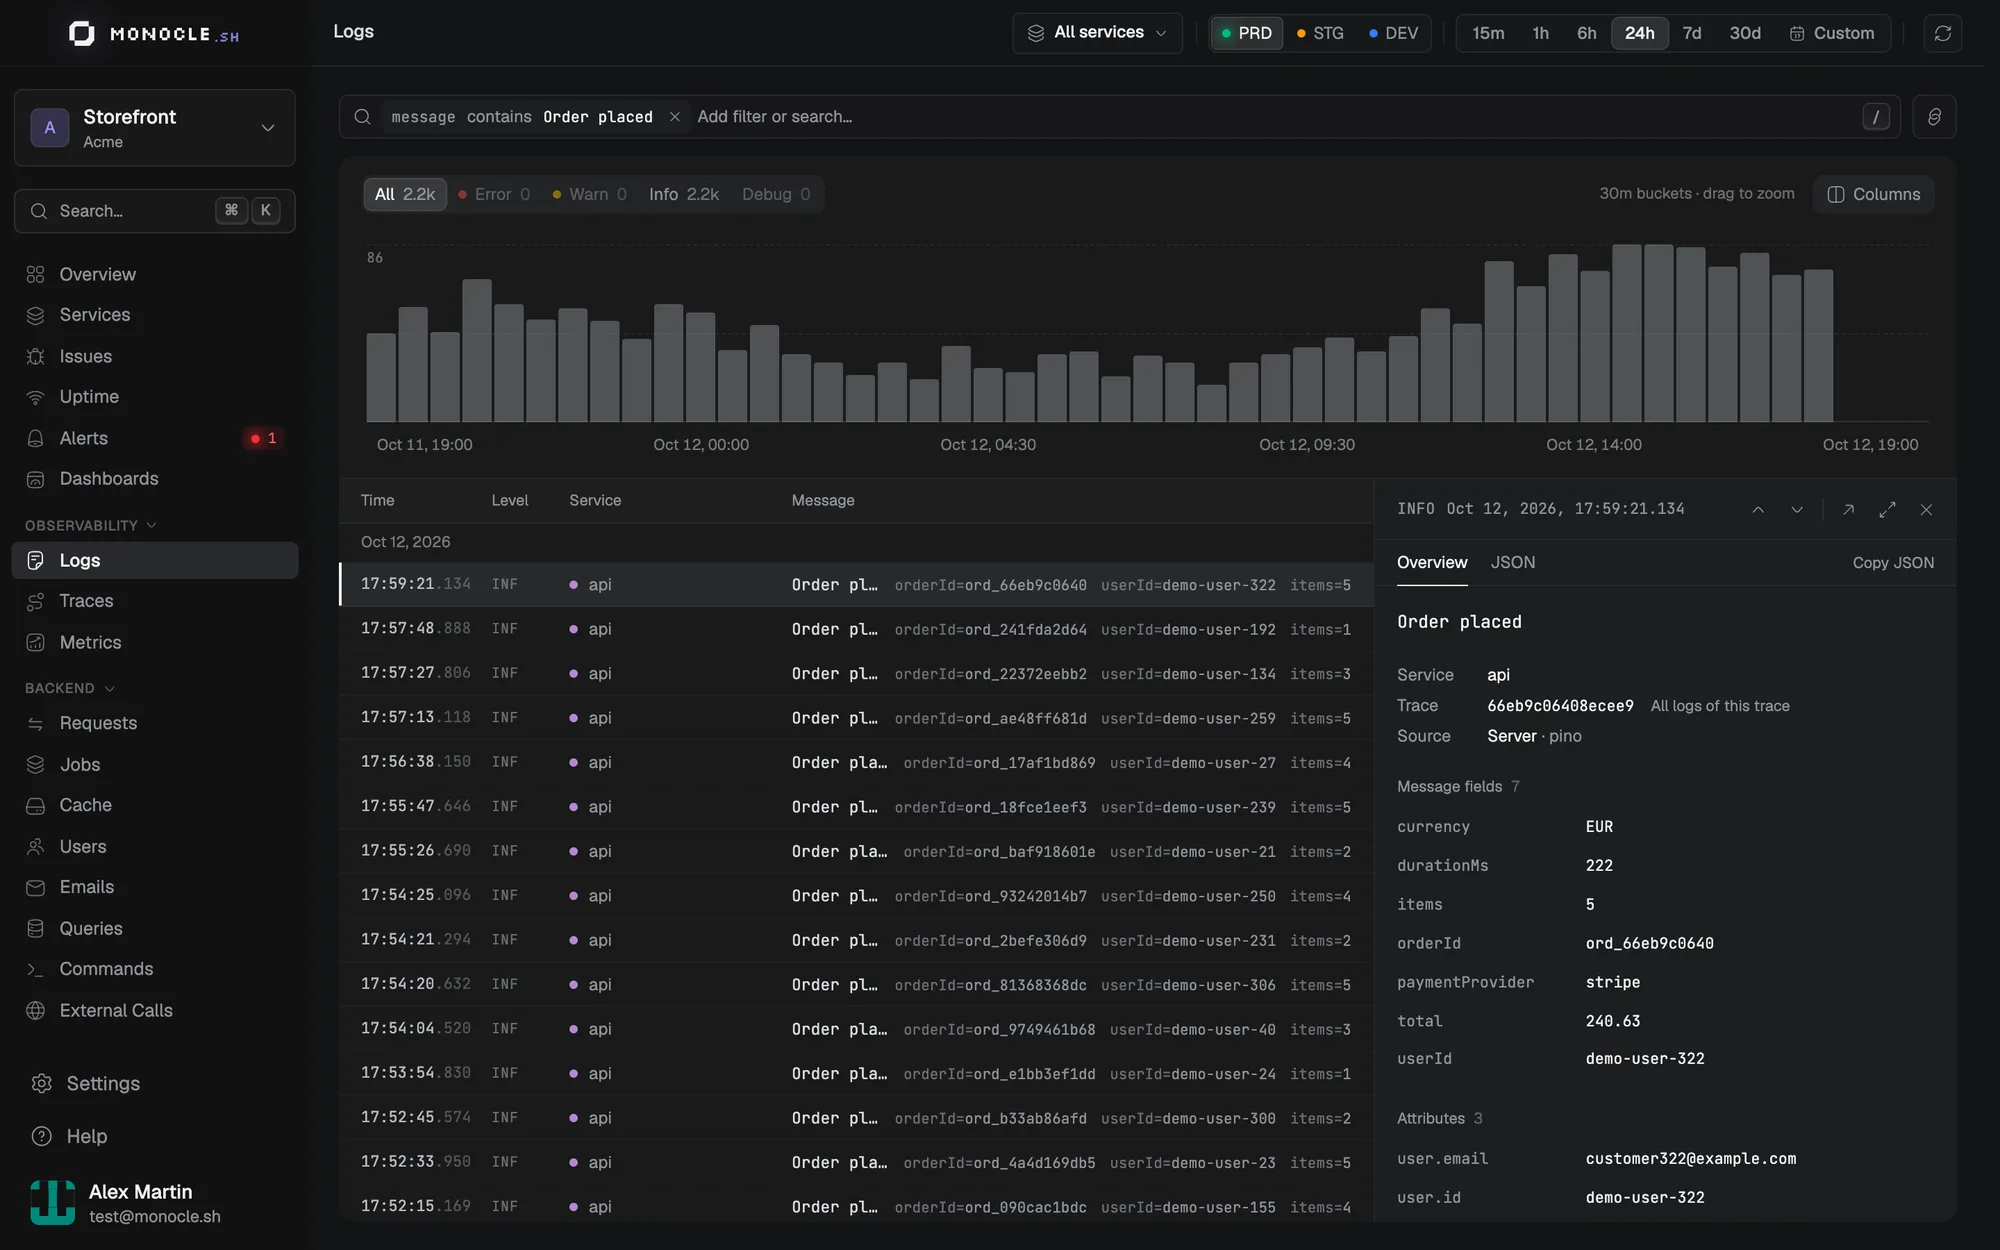
Logs
The Logs explorer is one surface now, with one search bar. Type a field, and it suggests values with their counts. Pick several values, switch to is not, contains, starts with, or a comparison, or type the filter directly: status>=500, path^/auth.
Drag across the histogram to zoom into a period. Add any attribute as a column. Click a log to open a panel with the logs of the same trace or the same service, the raw JSON, and a fullscreen view with f. JSON logs from pino or winston show their message, with the fields next to it and serialized errors rendered with their stack.
Traces
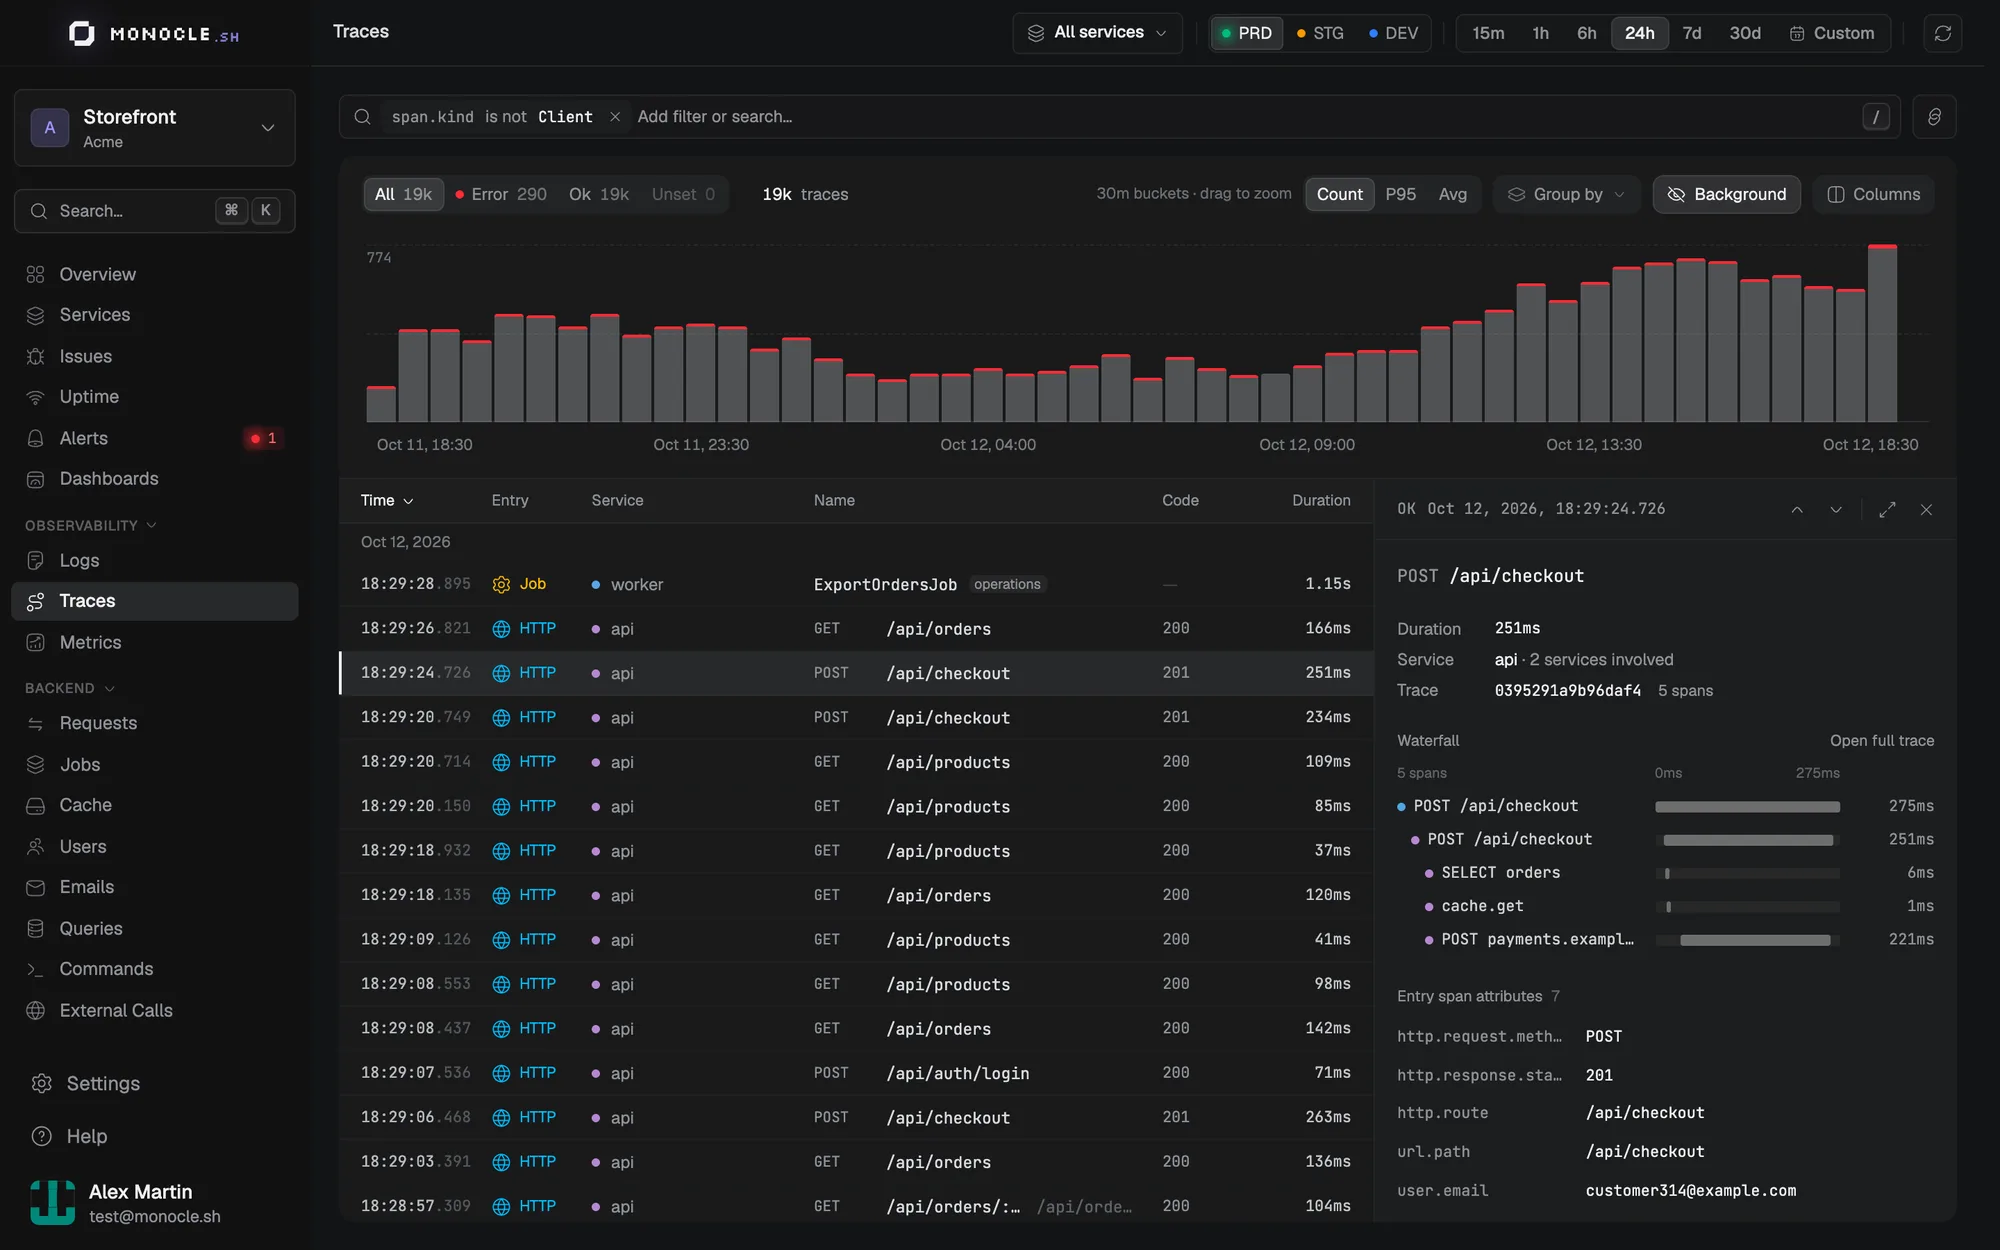
The Traces explorer uses the same search bar, so duration>2s or span.kind filters work the way they do in Logs. Results scroll forever instead of paging, and you sort them by time or duration. The chart shows count, P95, or average, grouped by any field.
Each row shows its entry point: the HTTP route, the job and its queue, or the command. Click a row to preview the waterfall and the trace's logs before you open it.
The explorer also flags background spans: a database query or an HTTP call that runs outside any request, job, or command, and so starts its own trace. A few are normal. Many usually mean your instrumentation lost its context somewhere. A new docs page explains the common causes, and the preview panel can copy a prompt with the trace ID for your coding agent to track it down.
Trace detail
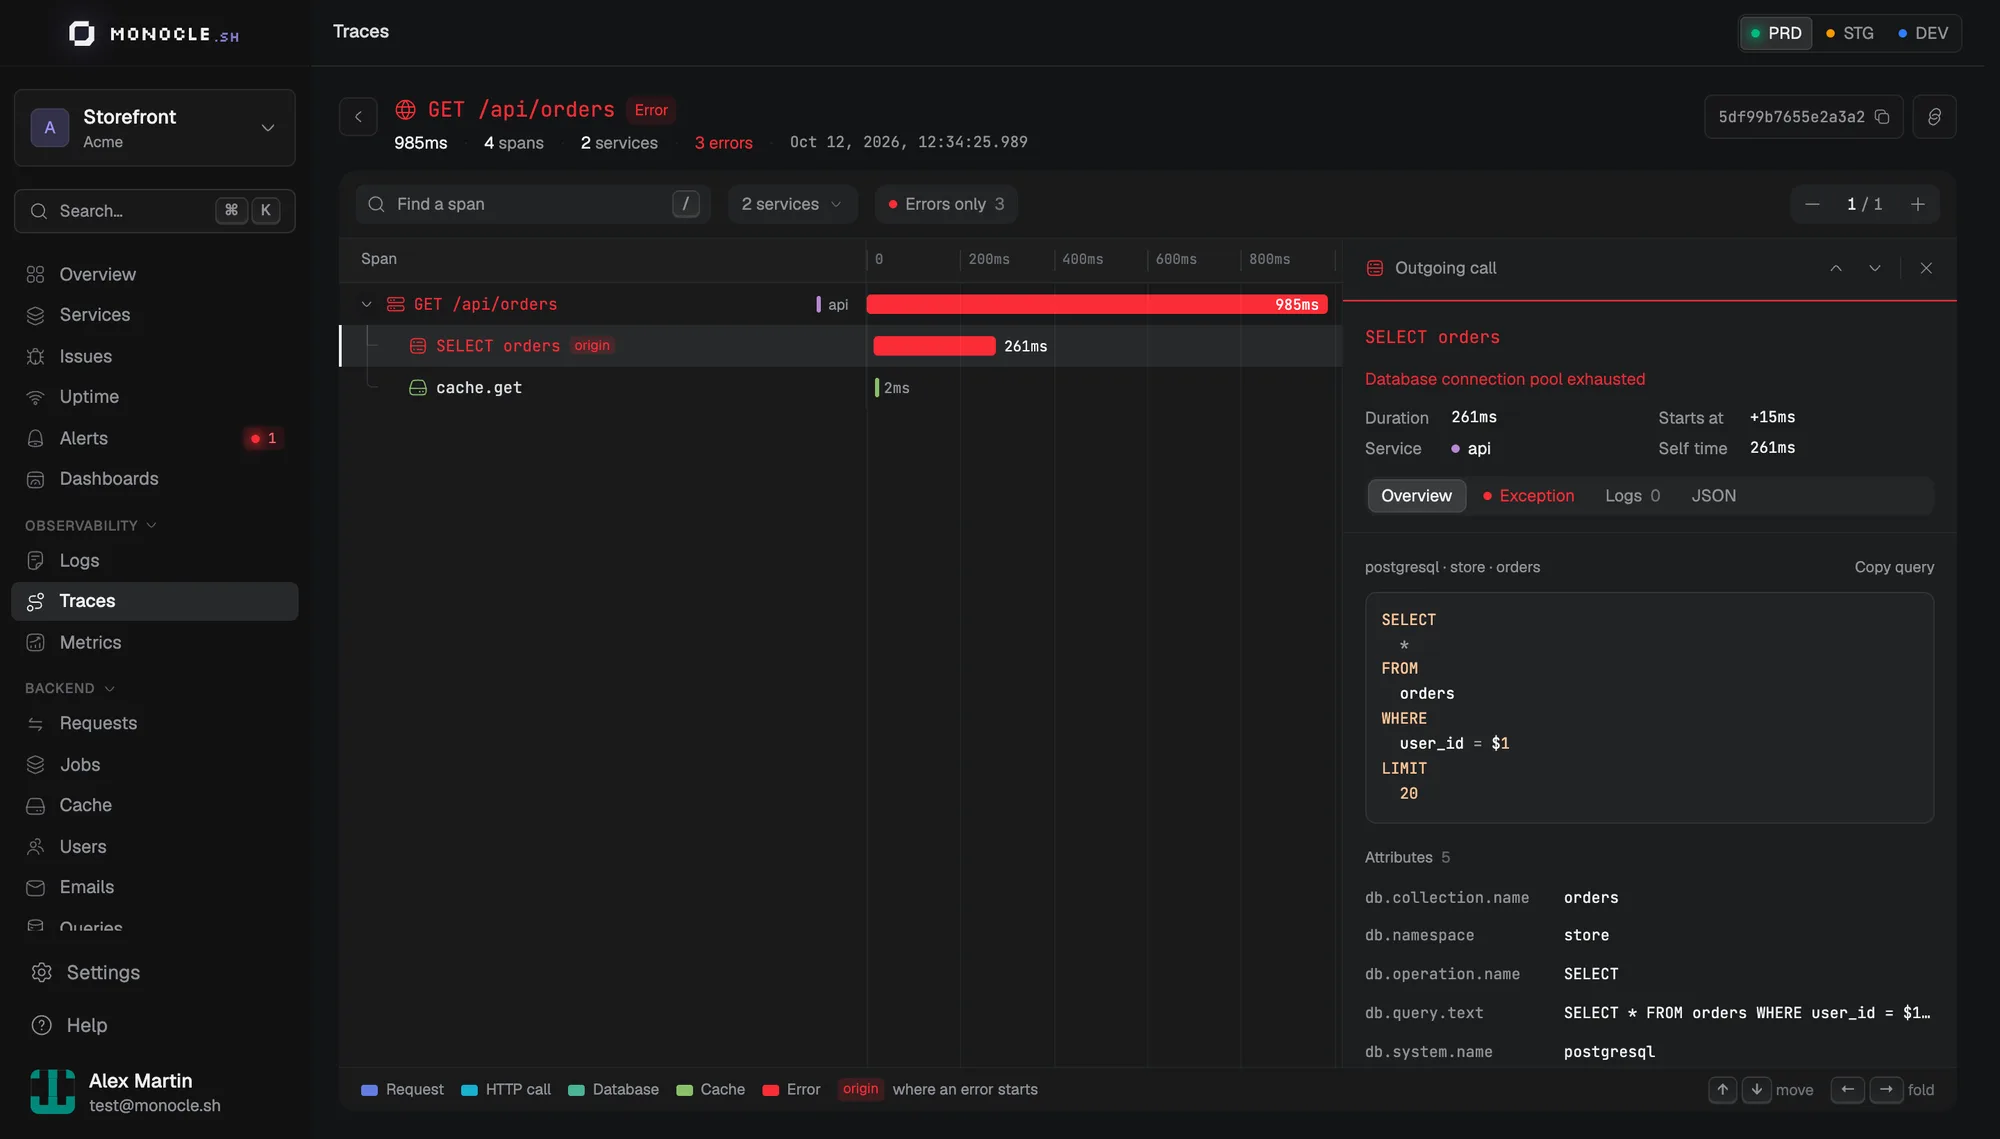
The waterfall was rebuilt from scratch:
- Colors show the kind of work: request, HTTP call, database, cache, queue, AI, or your own code. Red is only for errors, and the span where an error started is marked.
- Within one service, a client call and the server span it reached merge into one row, with the network wait drawn before the bar. Across services, they nest instead.
- Repeated siblings collapse into one row, like
UPDATE stock ×3. - Logs show up as markers under the span that wrote them.
Find a span with /, filter by service or errors only, expand or collapse one level at a time, and move with the arrow keys. The span panel adapts to the span: a SQL query shows highlighted SQL, an LLM call shows its token usage, and requests, cache calls, jobs, and emails each get their own summary.
Metrics and custom dashboards
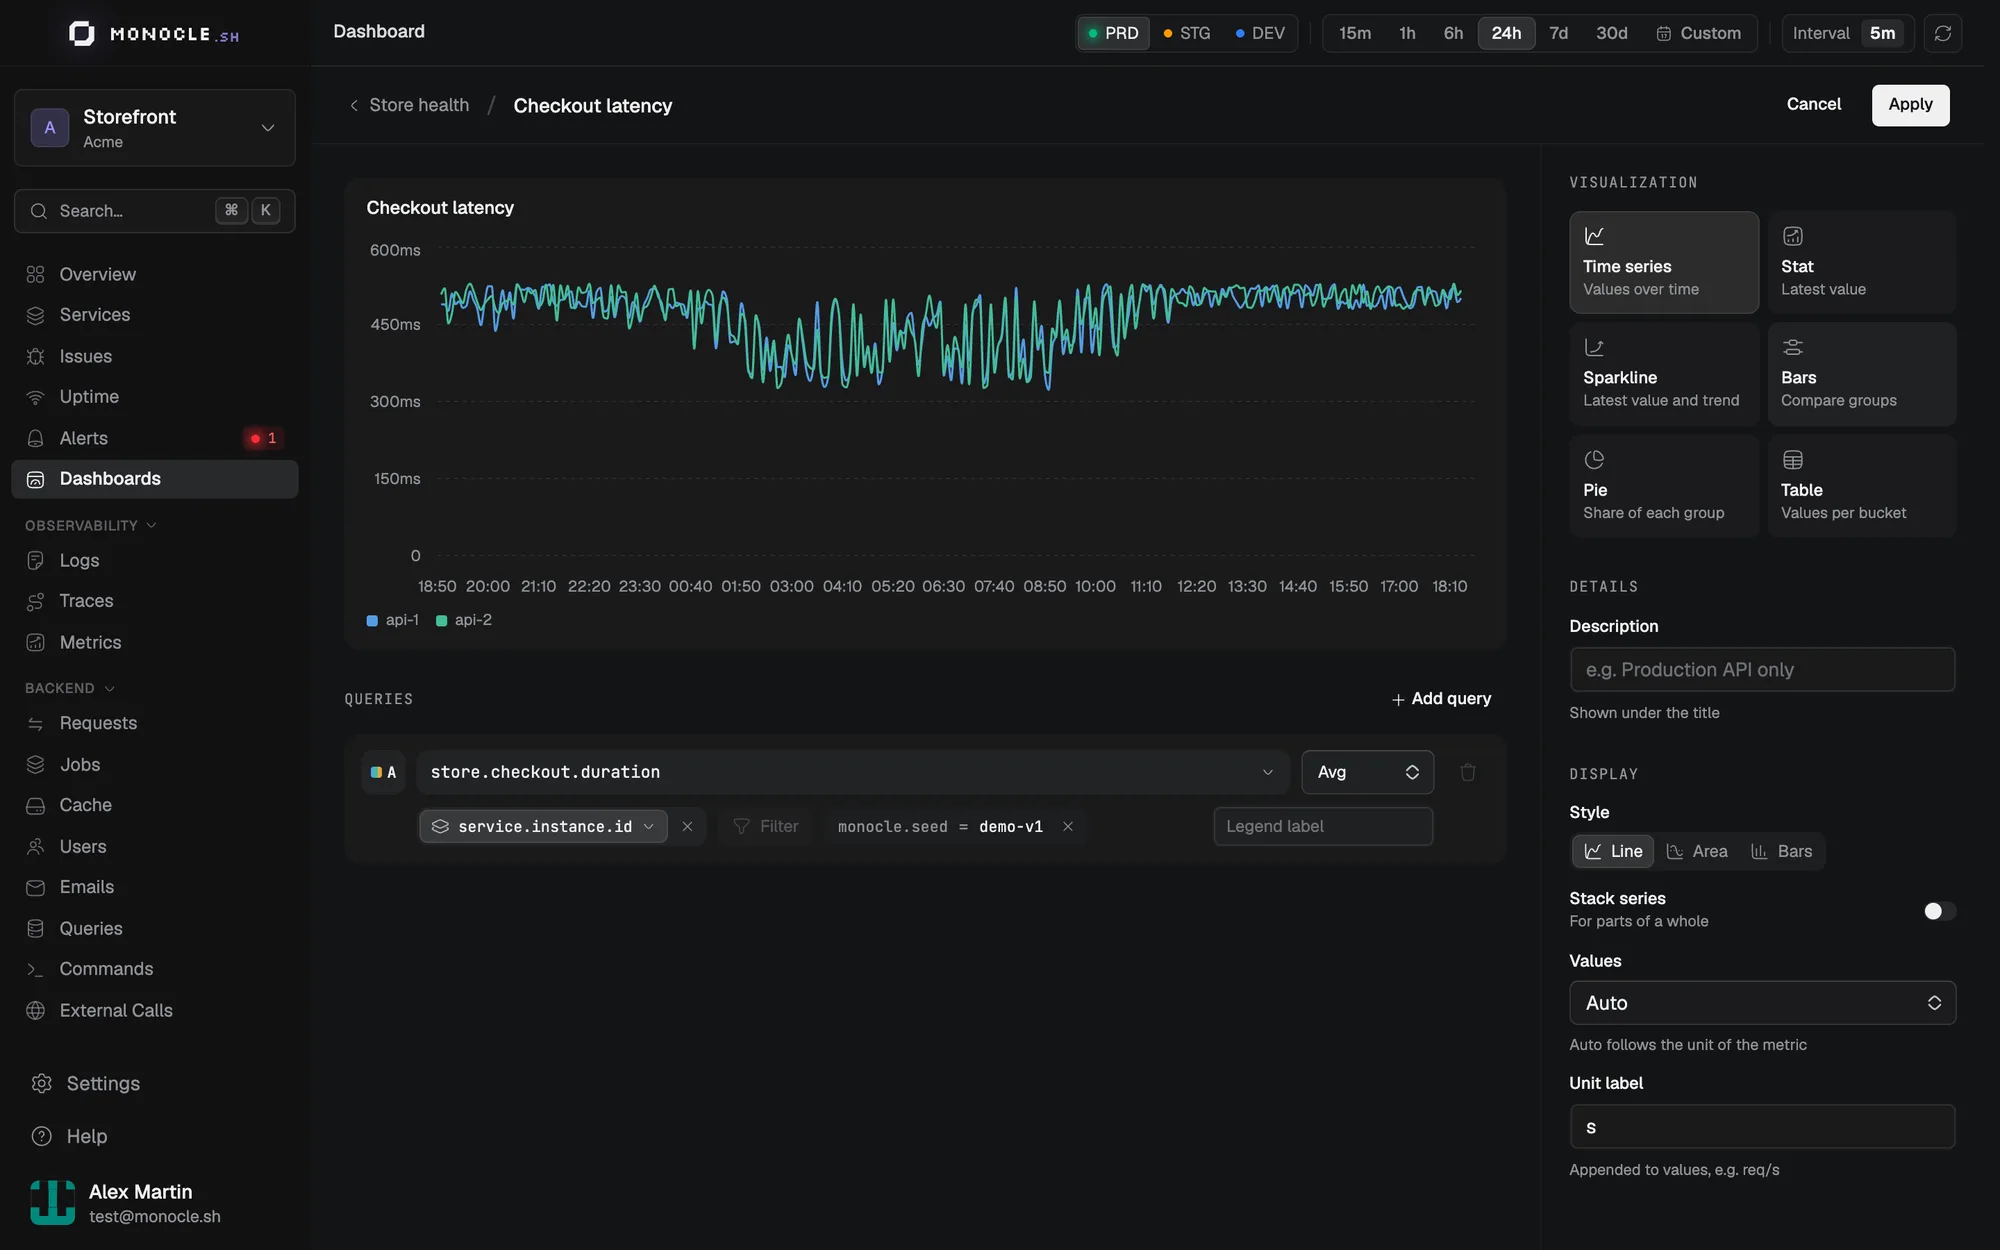
The metrics list groups metrics by namespace, with a small trend and the latest value for each. The detail page offers the aggregations that fit the metric type, suggests attribute filters, and lists every series: click one to hide it, double-click it to isolate it. Values are formatted from their OpenTelemetry unit, so s shows as 240ms and By as MB.
Custom dashboards got the same care. The list shows a miniature of each layout. In the widget editor, you write a query like a sentence (metric, aggregation, group by, filters) and see a live preview. Any single-query widget opens in the Metrics explorer.
Settings and the rest
Settings pages share one layout now: organization, project, members, teams, notifications. You can drop an image to set an avatar or a logo.
The Usage page follows your billing period, with a projection to its end and a comparison with the previous one. Break the daily volume down by signal, project, environment, or service, and click a project or an environment to narrow the page to it. Ask your agent copies a prompt with your heaviest services, log levels, and metric series, so your coding agent can tell you what to sample or cut.
Smaller things you'll notice:
- The time range picker has quick ranges (today, yesterday, last 7 days, this month) that follow your timezone.
- Hovering a timestamp shows it in your settings timezone and your device timezone, so you know which one you're reading.
- Pages show skeletons while they load instead of a full-page spinner.
- The login page and the 404 page got a dithered 3D Monocle.
A lot of work went into speed as well. The services page reads from pre-computed aggregates, several pages make fewer ClickHouse queries, and the app no longer refetches everything every time you come back to the tab.
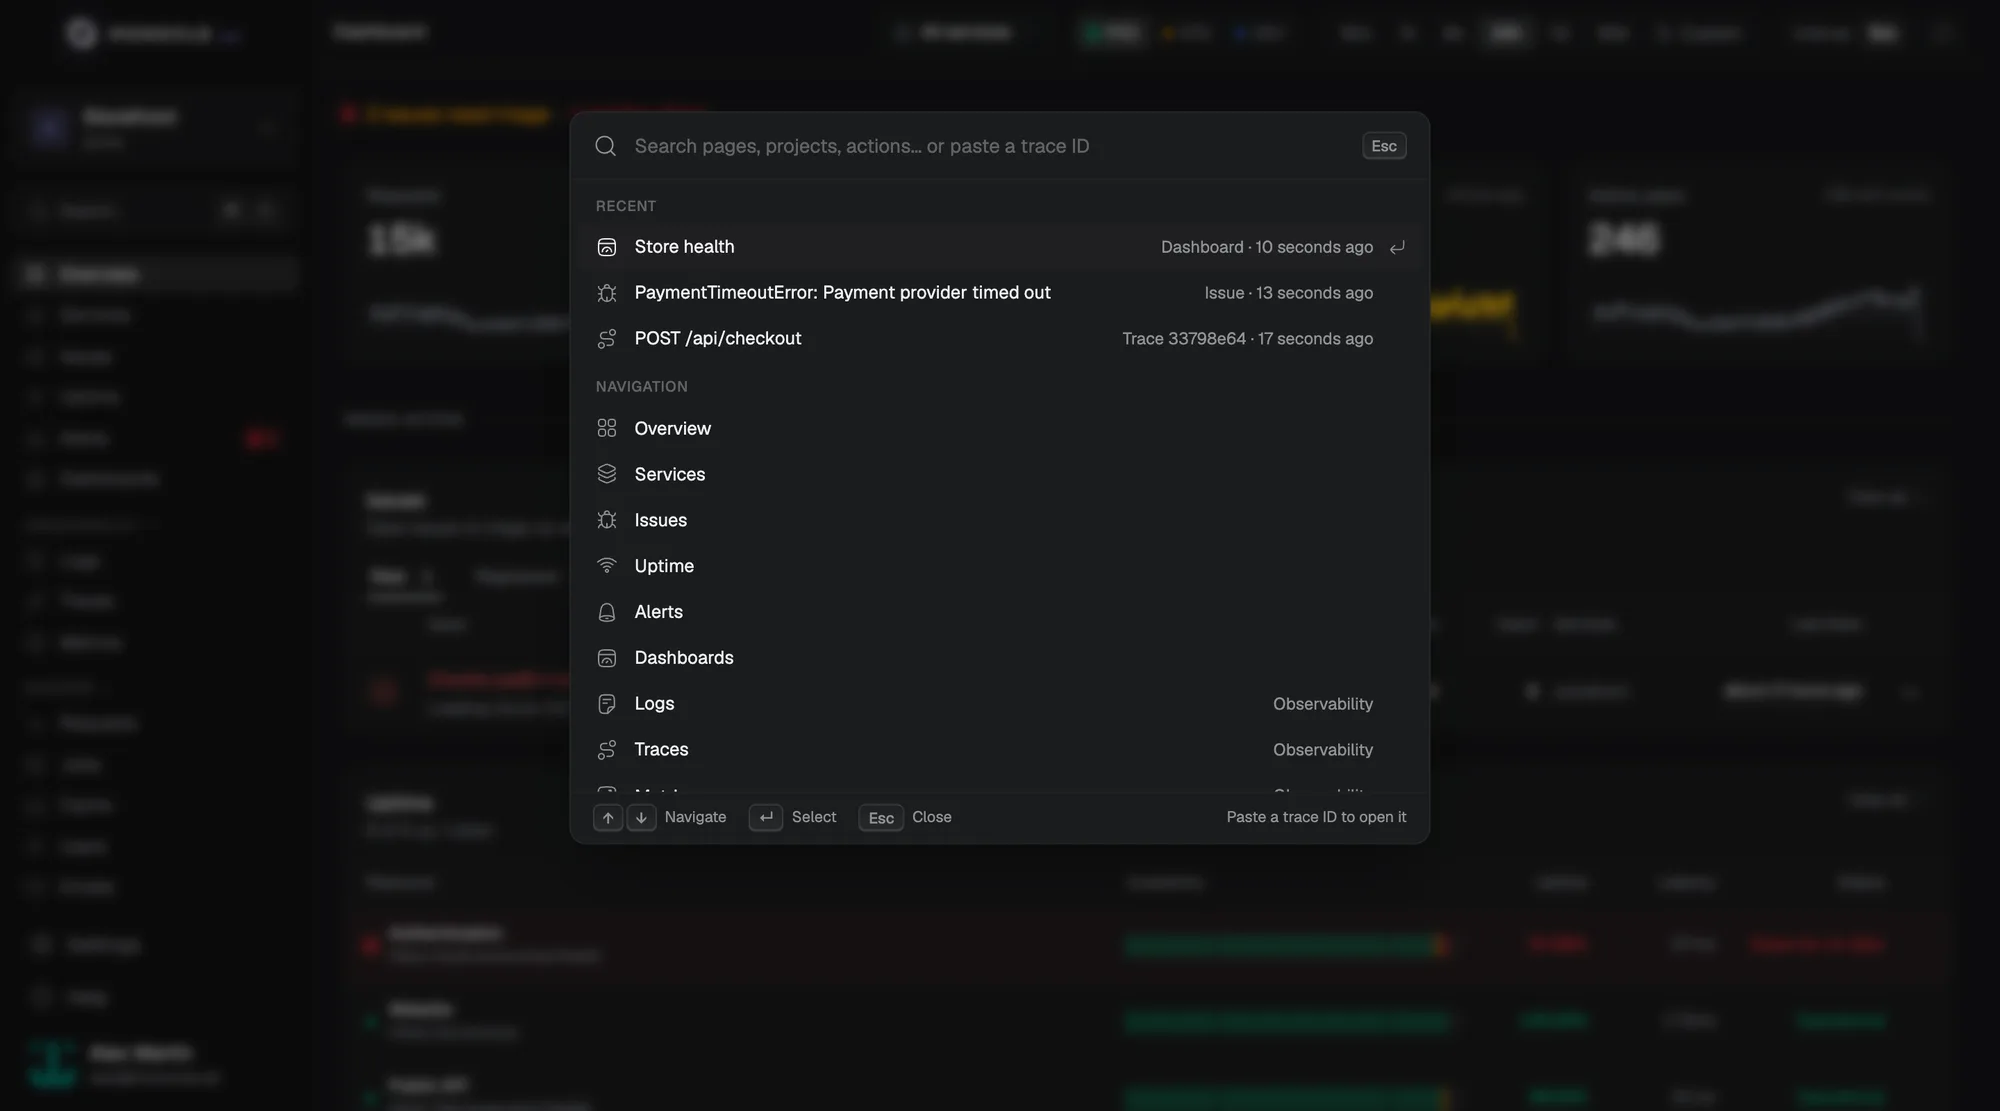
Get anywhere with the command palette
Press ⌘K on macOS or Ctrl+K elsewhere, or click Search… in the sidebar. From there you can:
- Jump to any page or settings section.
- Switch to another project or environment.
- Reopen the traces, issues, dashboards, and monitors you looked at recently.
- Paste a trace ID to open the trace.
- Switch between the dark, light, and system themes.
The explorers have keyboard shortcuts too. Press / to search, j and k to move between rows, Enter to open, and Escape to clear. Shortcuts show the right keys for your platform.
Upgrade to the AdonisJS agent 2.x
This is the one section where you have something to do.
@monocle.sh/adonisjs-agent 2.x no longer bundles the BullMQ, Vercel AI, Mastra, Bentocache, and MCP integrations. Each one is now its own package. The agent's bundle is much smaller because you only ship the integrations you use. HTTP, database, mail, queue, and CLI instrumentation stay built in.
If you use none of those five integrations, upgrade the agent and you're done. If you use any of them, install the matching packages:
npm install @monocle.sh/adonisjs-agent@^2.0.0
npm install @monocle.sh/instrumentation-bullmq @monocle.sh/instrumentation-vercel-ai
Then move their options into integrations:
+import { bullmq } from '@monocle.sh/instrumentation-bullmq/integration'
+import { vercelAi } from '@monocle.sh/instrumentation-vercel-ai/integration'

 export default defineConfig({
-  bullmq: { useProducerSpanAsConsumerParent: false },
-  ai: { recordInputs: false, recordOutputs: false },
+  integrations: [
+    bullmq({ useProducerSpanAsConsumerParent: false }),
+    vercelAi({ recordInputs: false, recordOutputs: false }),
+  ],
 })
Helpers moved too. Import withConversationId from @monocle.sh/instrumentation-vercel-ai, and instrumentMcpServer from @monocle.sh/instrumentation-mcp.
If you upgrade without moving your options, the old keys fail the typecheck, and the integrations
stay off at runtime. You won't get an error, only missing spans. Mastra also no longer reuses the
ai redaction options, so set recordInputs and recordOutputs on mastra() again.
The full steps, including Mastra and Bentocache, are in the AdonisJS agent 2.0.0 migration guide.
Agent 2.x also brings:
- DSN support, through
dsnin the config orMONOCLE_DSN. - A fix for apps that ship their own copy of
@boringnode/queue. Jobs now get their consumer span, and their queries no longer show up as orphan traces. - A new Kysely instrumentation,
@monocle.sh/instrumentation-kysely, with query, transaction, and connection pool metrics. - Automatic version detection, since 2.4, for deployments.
The Effect agent supports DSNs too.
More focus on MCP
Holmes, the in-app assistant, is gone, along with the chat. We're putting that effort into the existing MCP server so you can use Monocle from the coding agent you already work with.
If you haven't connected it yet:
npx add-mcp https://api.monocle.sh/mcpIt already lets your agent investigate traces, logs, errors, and performance, and build custom dashboards. This release adds service setup and more Uptime tools.
Your agent can now declare a status incident from an outage and post updates until it's resolved. It must explicitly choose whether the incident is public.
Onboarding with your agent
Onboarding now gives you a setup prompt for Claude Code, Cursor, or Codex. Your agent reads your repository and uses the MCP setup_service tool to create services and get their DSNs and install instructions. You can also start from Set up with your agent on the Services page.
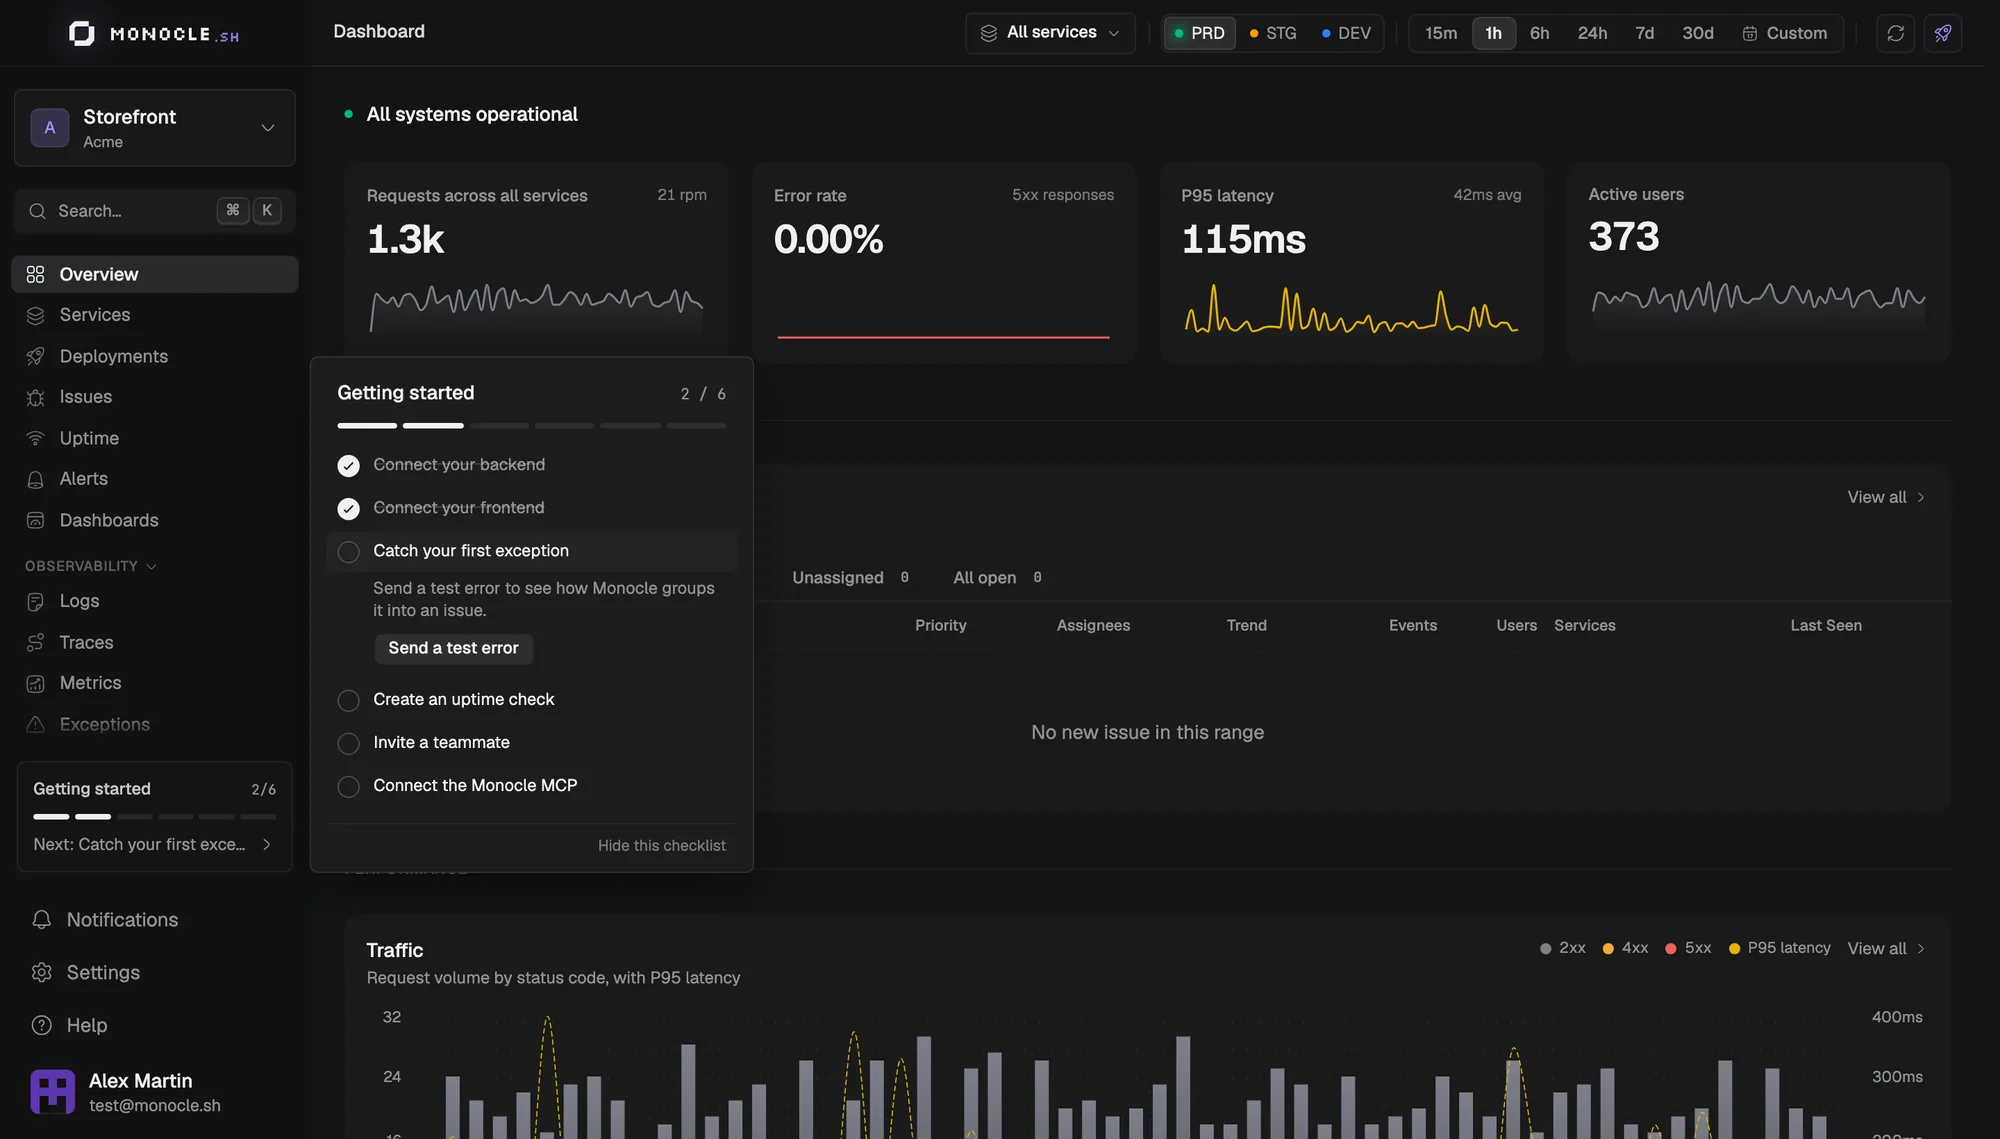
The Getting started checklist tracks your progress as you connect services, capture your first error, and invite teammates. Steps complete automatically from your data, and Send a test error lets you try the issue workflow.
Product analytics, in beta
The next production release also ships product analytics, behind a feature flag while we test it.
It uses the browser SDK's analytics() integration, with no cookies and no user identity. It gives you visitors, visits, pageviews, events, and bounce rate, plus traffic sources and UTM campaigns, locations on a world map, and browsers and devices. You can open any session to see where it came from and every page and event in order. Funnels show where people drop off between steps, compared with the previous period and broken down by source, country, or device.
Pages are grouped by route, like /blog/:slug, and each route unfolds into the real URLs behind it. Monocle guesses the route by replacing numbers, UUIDs, and hashes, or you pass your router's templates with analytics({ route }). Locations go down to the city.
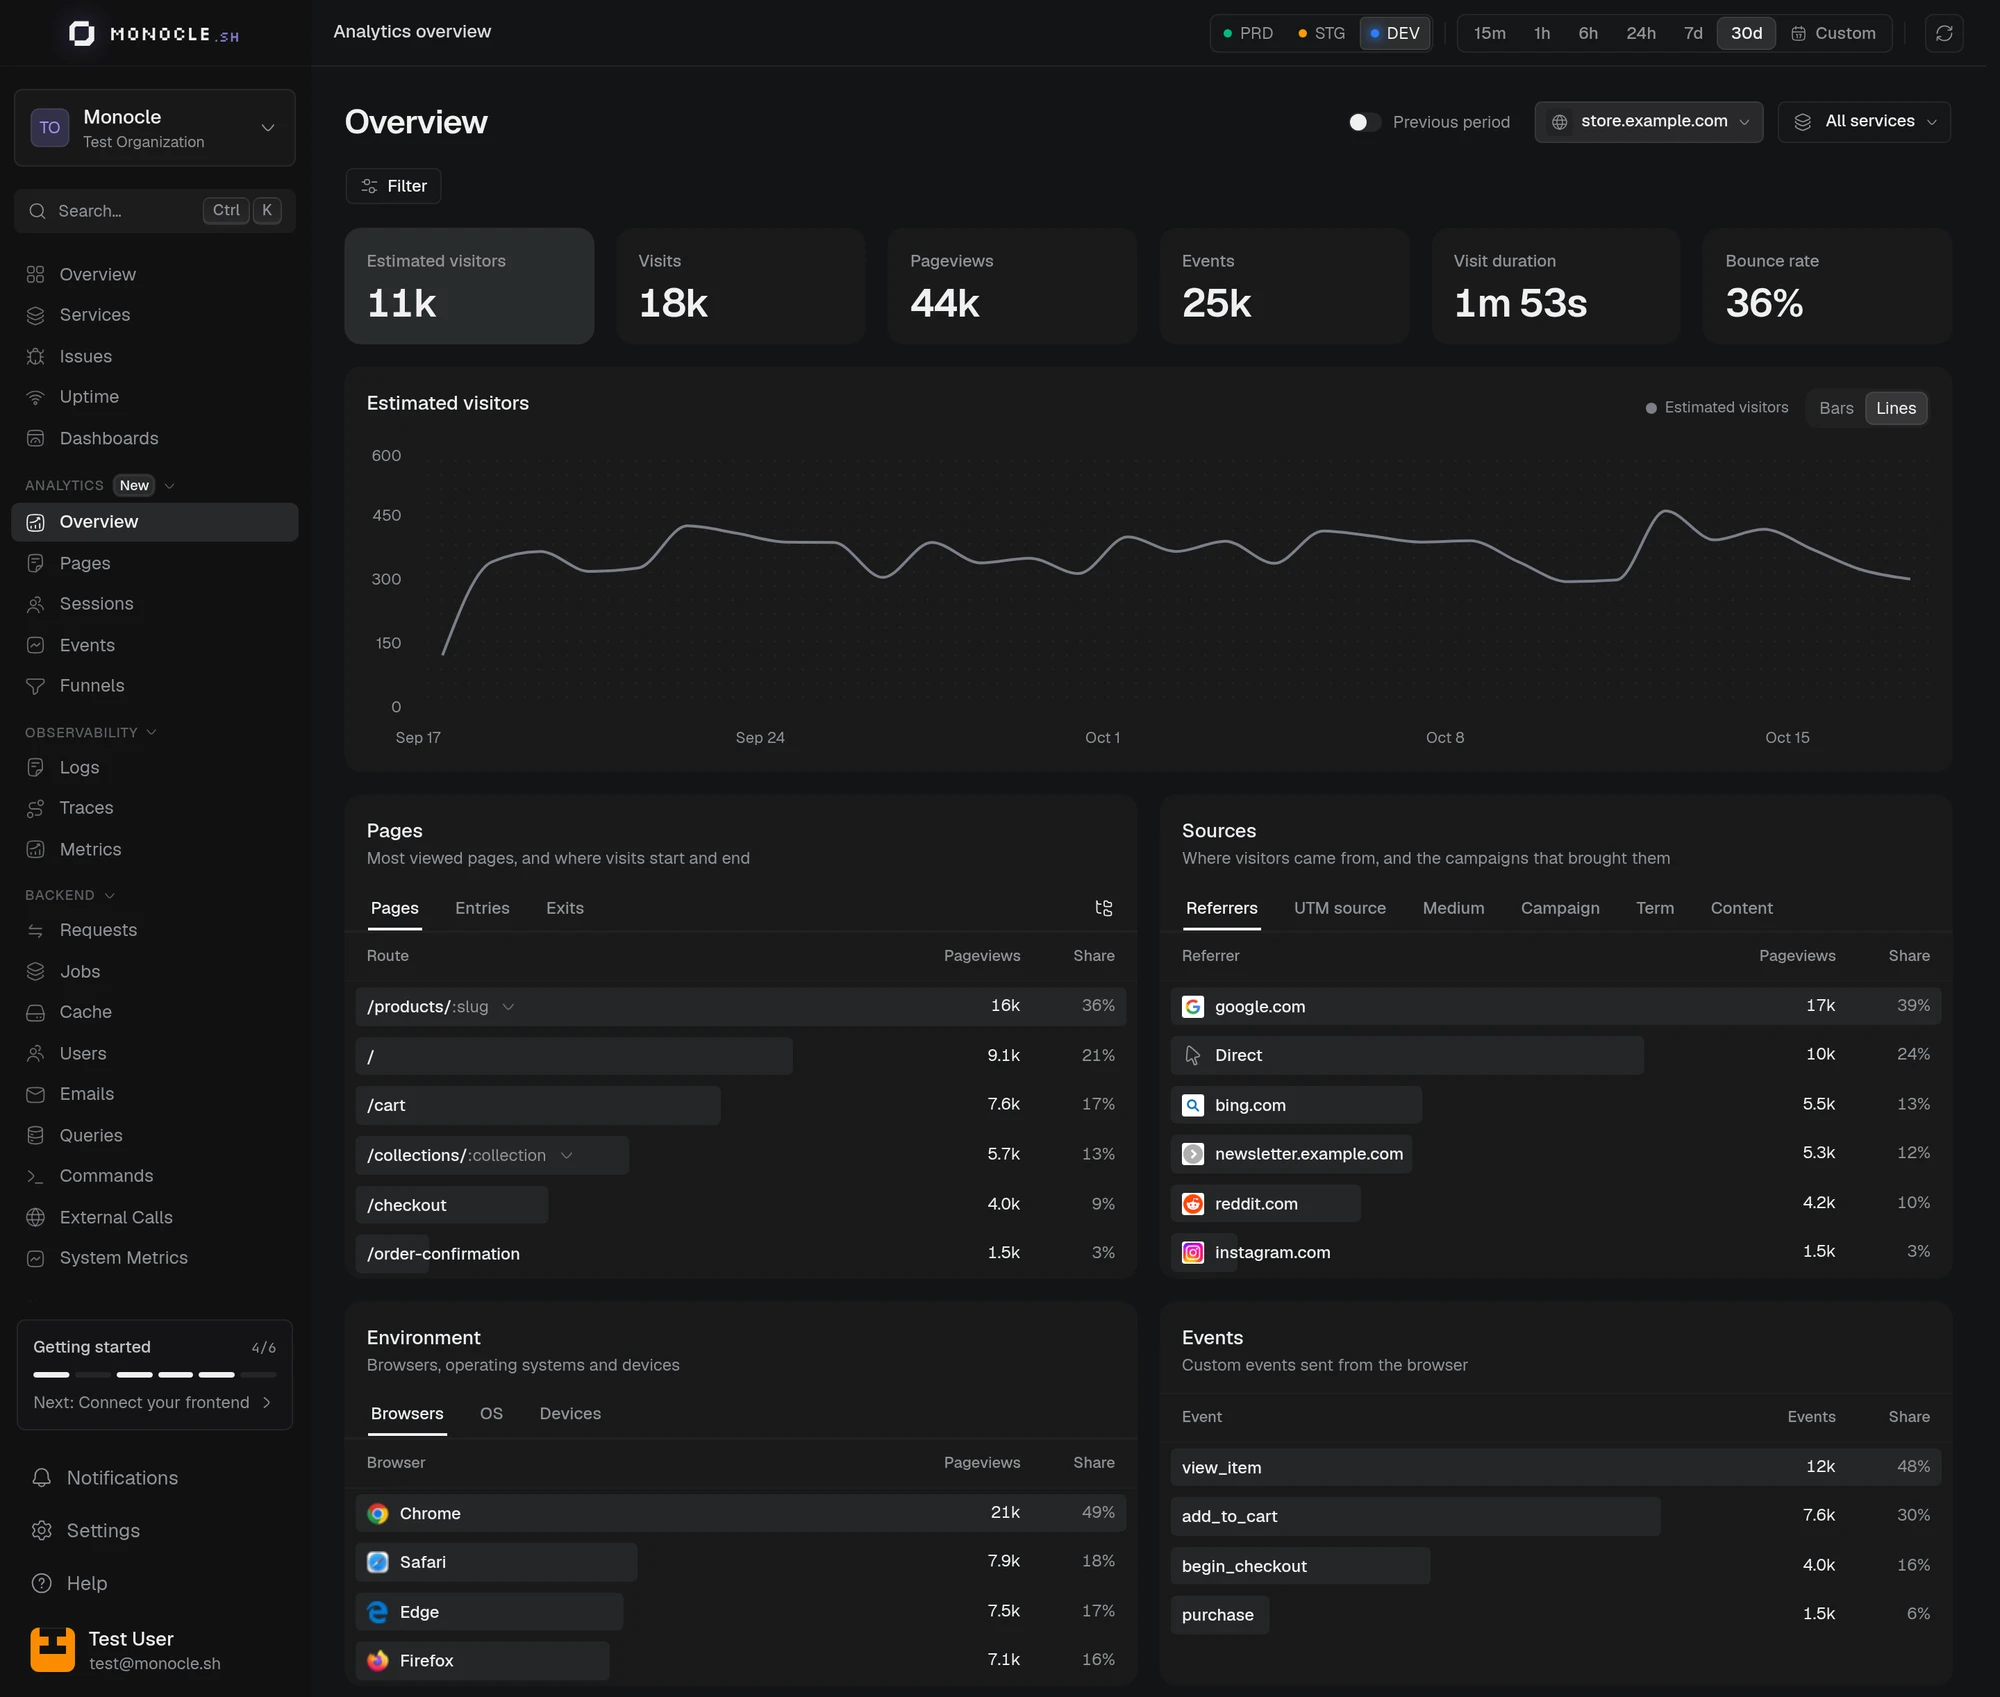
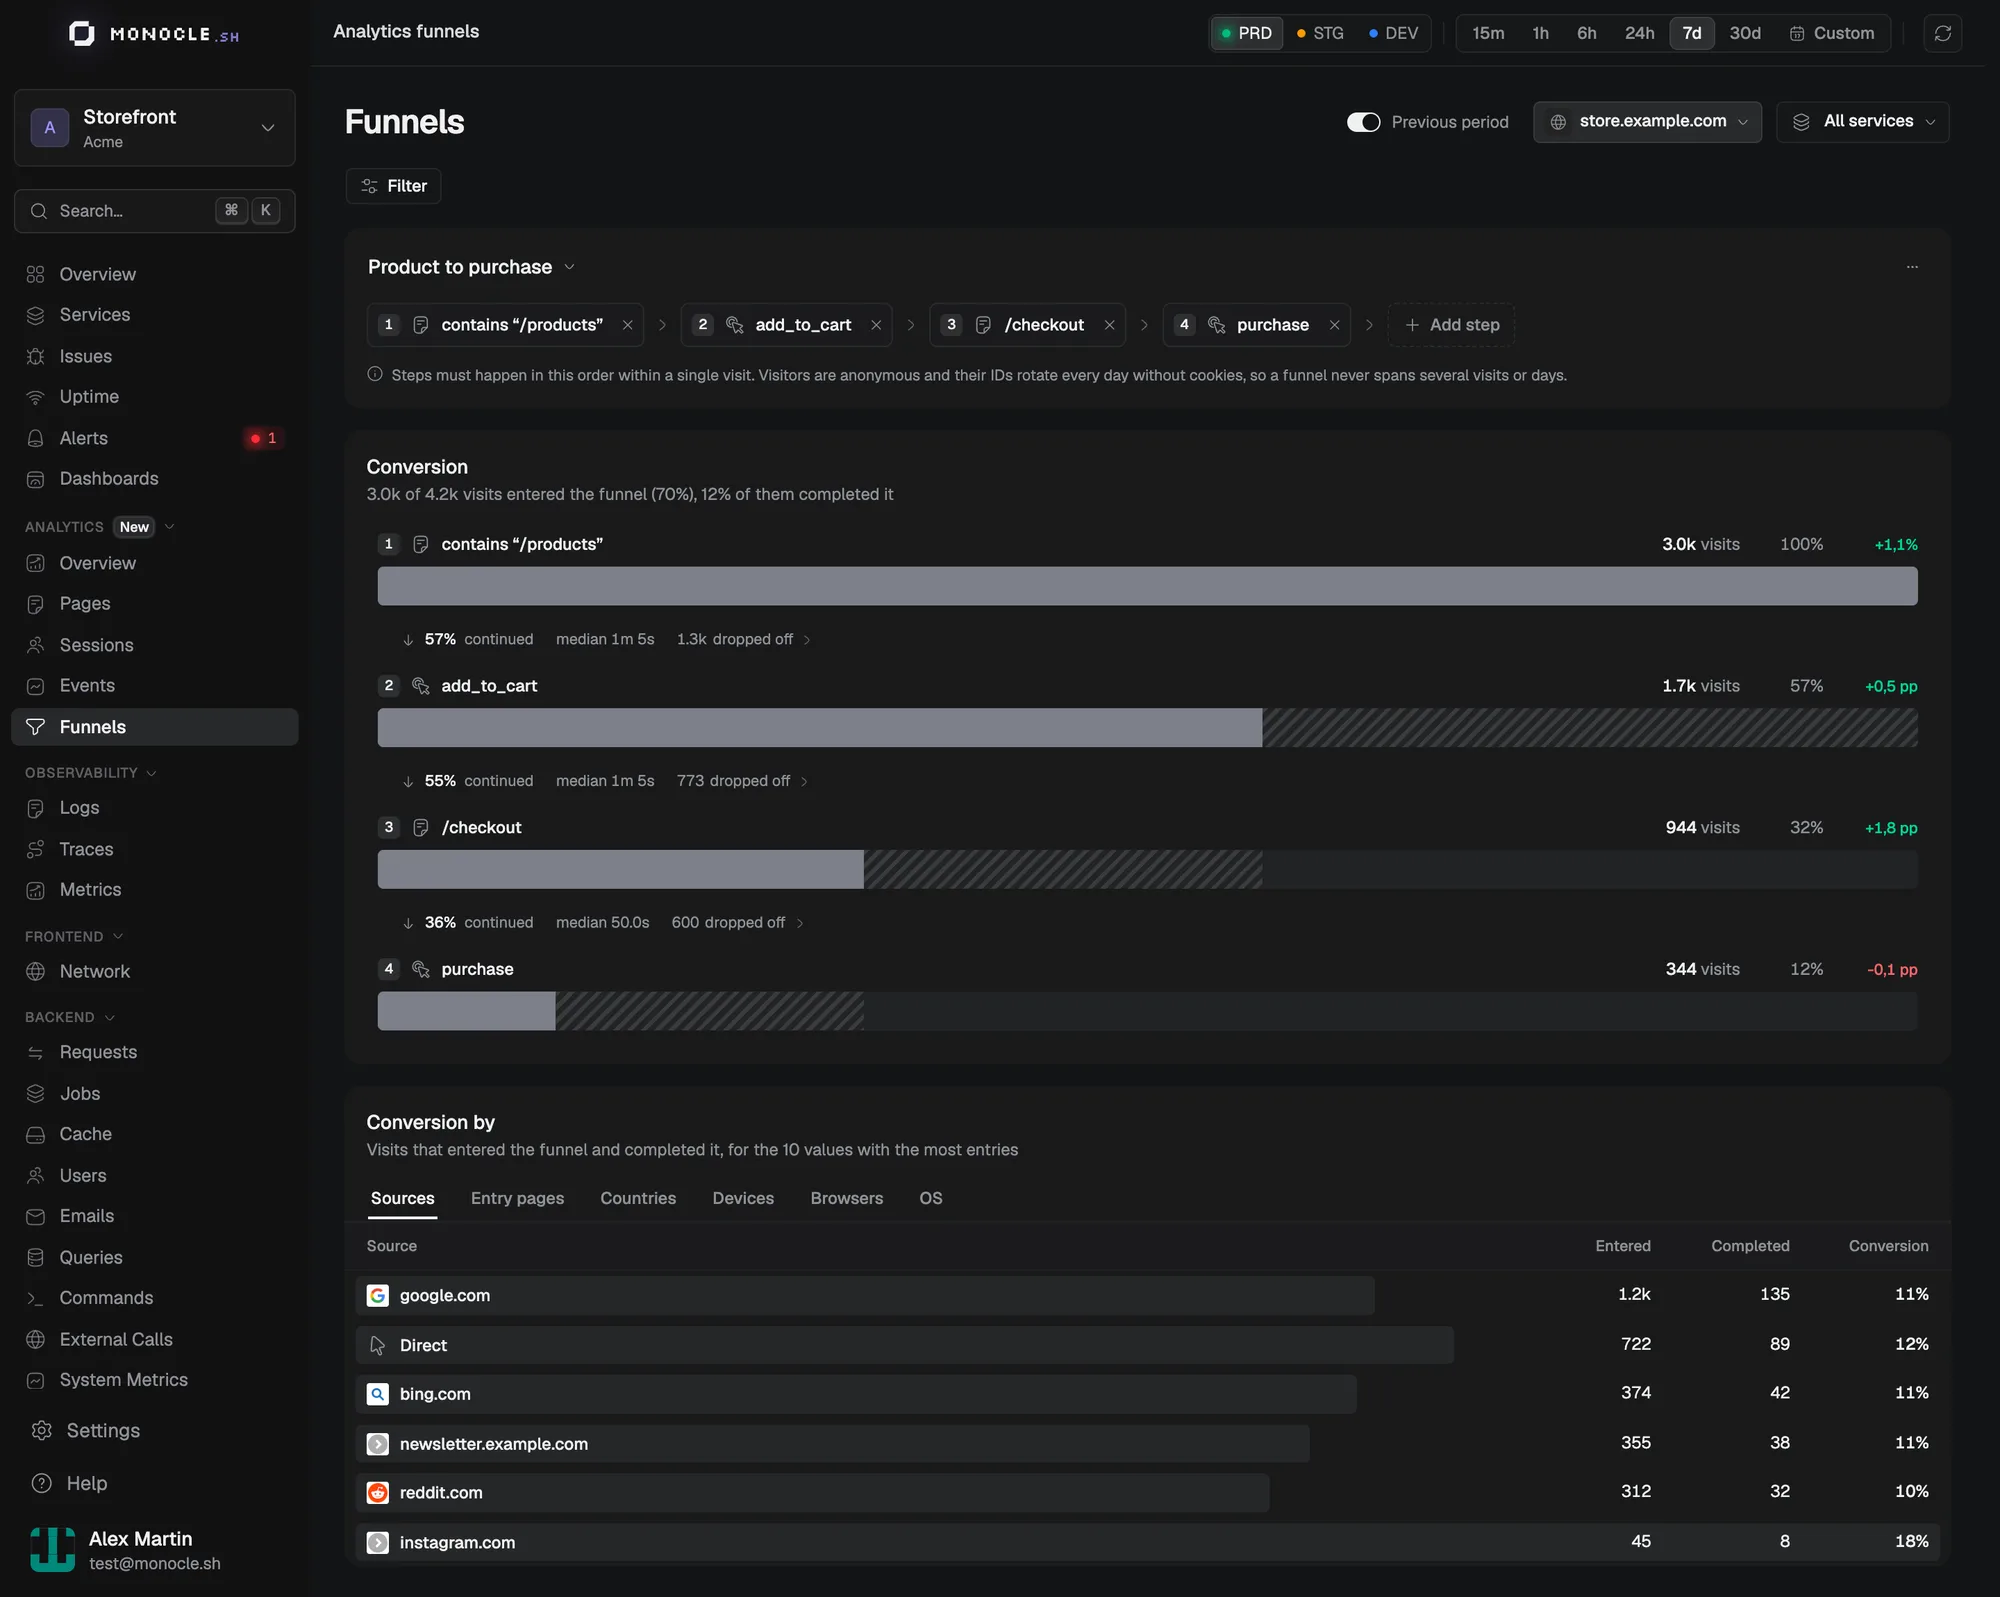
It sits next to your traces and errors, in the same project, from the same SDK.
Want to try analytics? Ask me on Discord or at support@monocle.sh, and I'll turn it on for your account.
Feedback and inbox
Send an idea, a bug, or a question from the feedback button. You can follow its status and reply in My feedbacks in your profile settings, with email and in-app notifications when I answer.
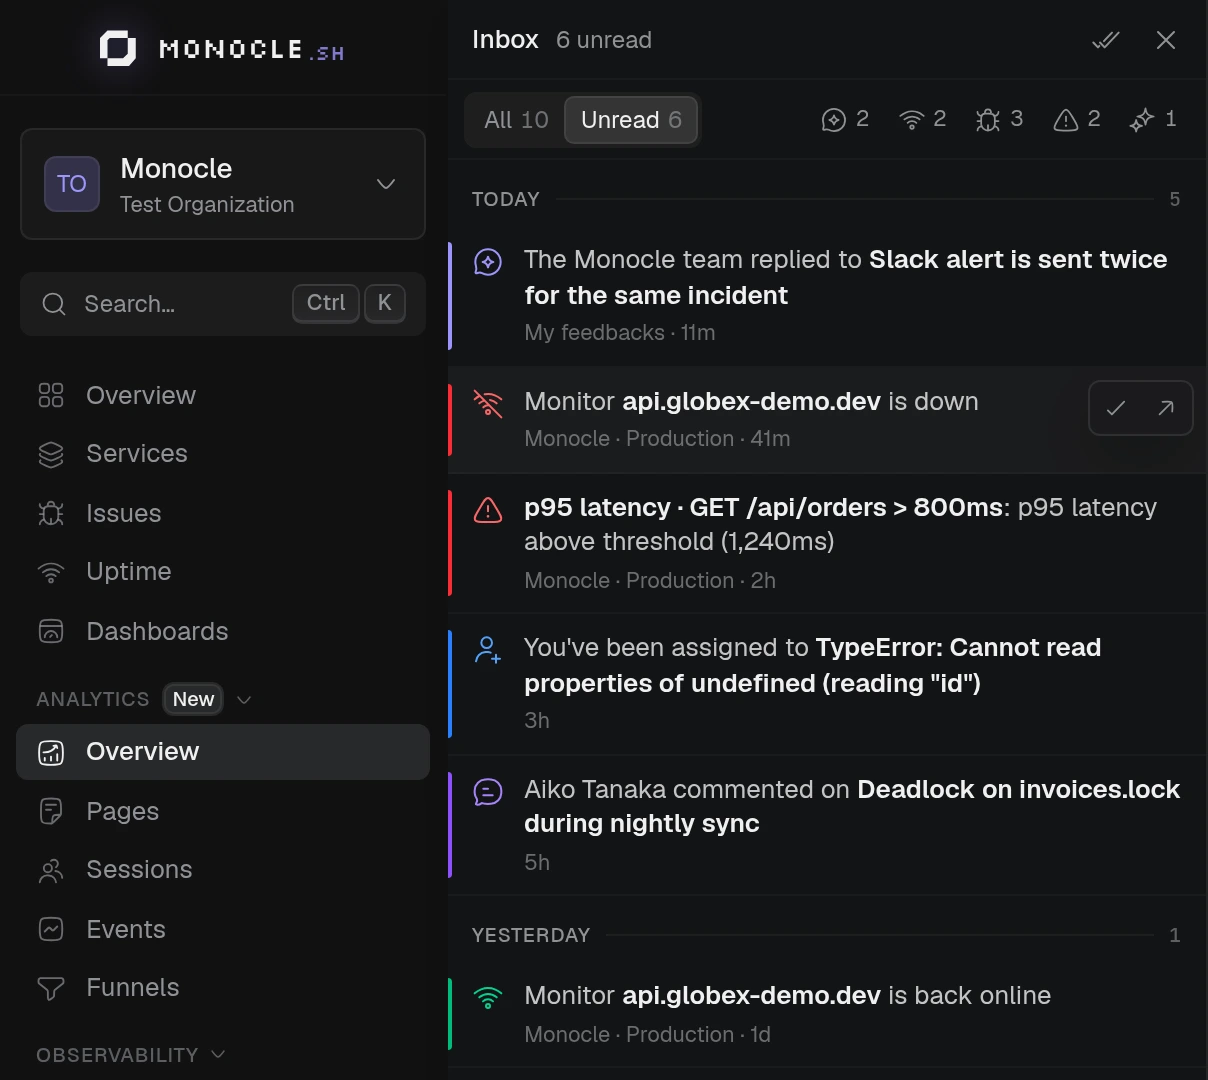
The new Inbox brings your notifications together, with filters for issues, alerts, Uptime, and more. Open it from the sidebar bell to catch up and jump to the issue, monitor, or feedback thread behind a notification.
Docs, rebuilt
The documentation was rewritten to follow the structure of the product:
- A quickstart, a page on core concepts, and a troubleshooting guide.
- Every dashboard has its own page, with real screenshots.
- AdonisJS setup is split into focused guides, and there's a guide to migrate from
@adonisjs/otel. - Not on AdonisJS? The Any OpenTelemetry SDK guide shows how to send data from any OpenTelemetry setup, and Semantic conventions lists the attributes Monocle understands.
Search finds the exact section you need, and each page has a button to copy it as Markdown or open it in ChatGPT or Claude. If you're signed in, setup snippets include your own DSN.
Wrapping up
That's a lot of new stuff, and every piece of it runs on Monocle itself: the API sends its traces through a DSN, and the frontend runs the browser SDK. If something feels off, I see it on my side too, but I'd rather hear it from you.
Find me on Discord, on Twitter/X, or at support@monocle.sh.
See what your apps
are really doing.
Traces, logs, errors and metrics for every app you ship. Bring it all into focus.