Introducing Monocle
Observability in 2026 is kind of a nightmare. So I built the thing I actually wanted: an observability platform for Node.js that works out of the box.
Let's be honest, in a lot of cases observability is a nightmare to set up and maintain.
You spend three days setting up configuration, a collector, some infra, setting up your application instrumentation, struggle with OpenTelemetry monkeypatches and weird SDKs. Another week building Grafana dashboards that nobody looks at after the first Monday. Then you juggle between four different tools, and somehow none of them talk to each other. You write YAML configs longer than your actual application code. And when something finally breaks in production, you stare at your bloated dashboards with 100 panels and 20 series each, and you end up pushing a hotfix with some console.logs because it's faster.
Yeah. I've been there too. Many times.
A bit of backstory
I'm Julien, part of the AdonisJS core team and freelancing for almost 10 years now. I've spent an unreasonable amount of my career dealing with observability tooling. Setting things up, configuring exporters, building dashboards, watching them go out of sync the moment someone updates something, then doing it all over again. Tried many tools, self-hosted and SaaS, open source and commercial. But was never really satisfied.
At some point I just... stopped. And started building the thing I actually wanted.
Monocle started as a personal tool, something I wanted for myself. Something that just works, dead simple to set up, something I can configure for my clients in 10 minutes without having to explain 40 different concepts.
Turns out some other people wanted this too. So here we are.
So what is Monocle?
Monocle is an all-in-one observability platform. Traces, logs, errors, metrics, AI, uptime, pre-built dashboards for cache, jobs, requests, mails, all in one place. Pre-configured, pre-built, ready to go.
Monocle is built with AdonisJS as a first-class citizen. But since it's built on OpenTelemetry, we'll naturally support other frameworks down the road.
Note
For now the focus is on AdonisJS, but framework support is expanding. Stay tuned for what comes next.
In this article, I'll walk you through what Monocle does, highlight the biggest features, without going too deep into the details because otherwise this post would be 20 pages long.
Setting up
If you're on AdonisJS, setup is a single command:
node ace add @monocle.sh/adonisjs-agentThat's it. Nothing to deploy, no YAML to write, no infrastructure to manage. Add your API key, restart your app, and everything starts flowing: HTTP requests, database queries, background jobs, cache operations, emails, CLI commands. All auto-instrumented out of the box.
When your app boots, you'll have dashboards waiting for you. Dashboards that are actually useful and easy to understand.
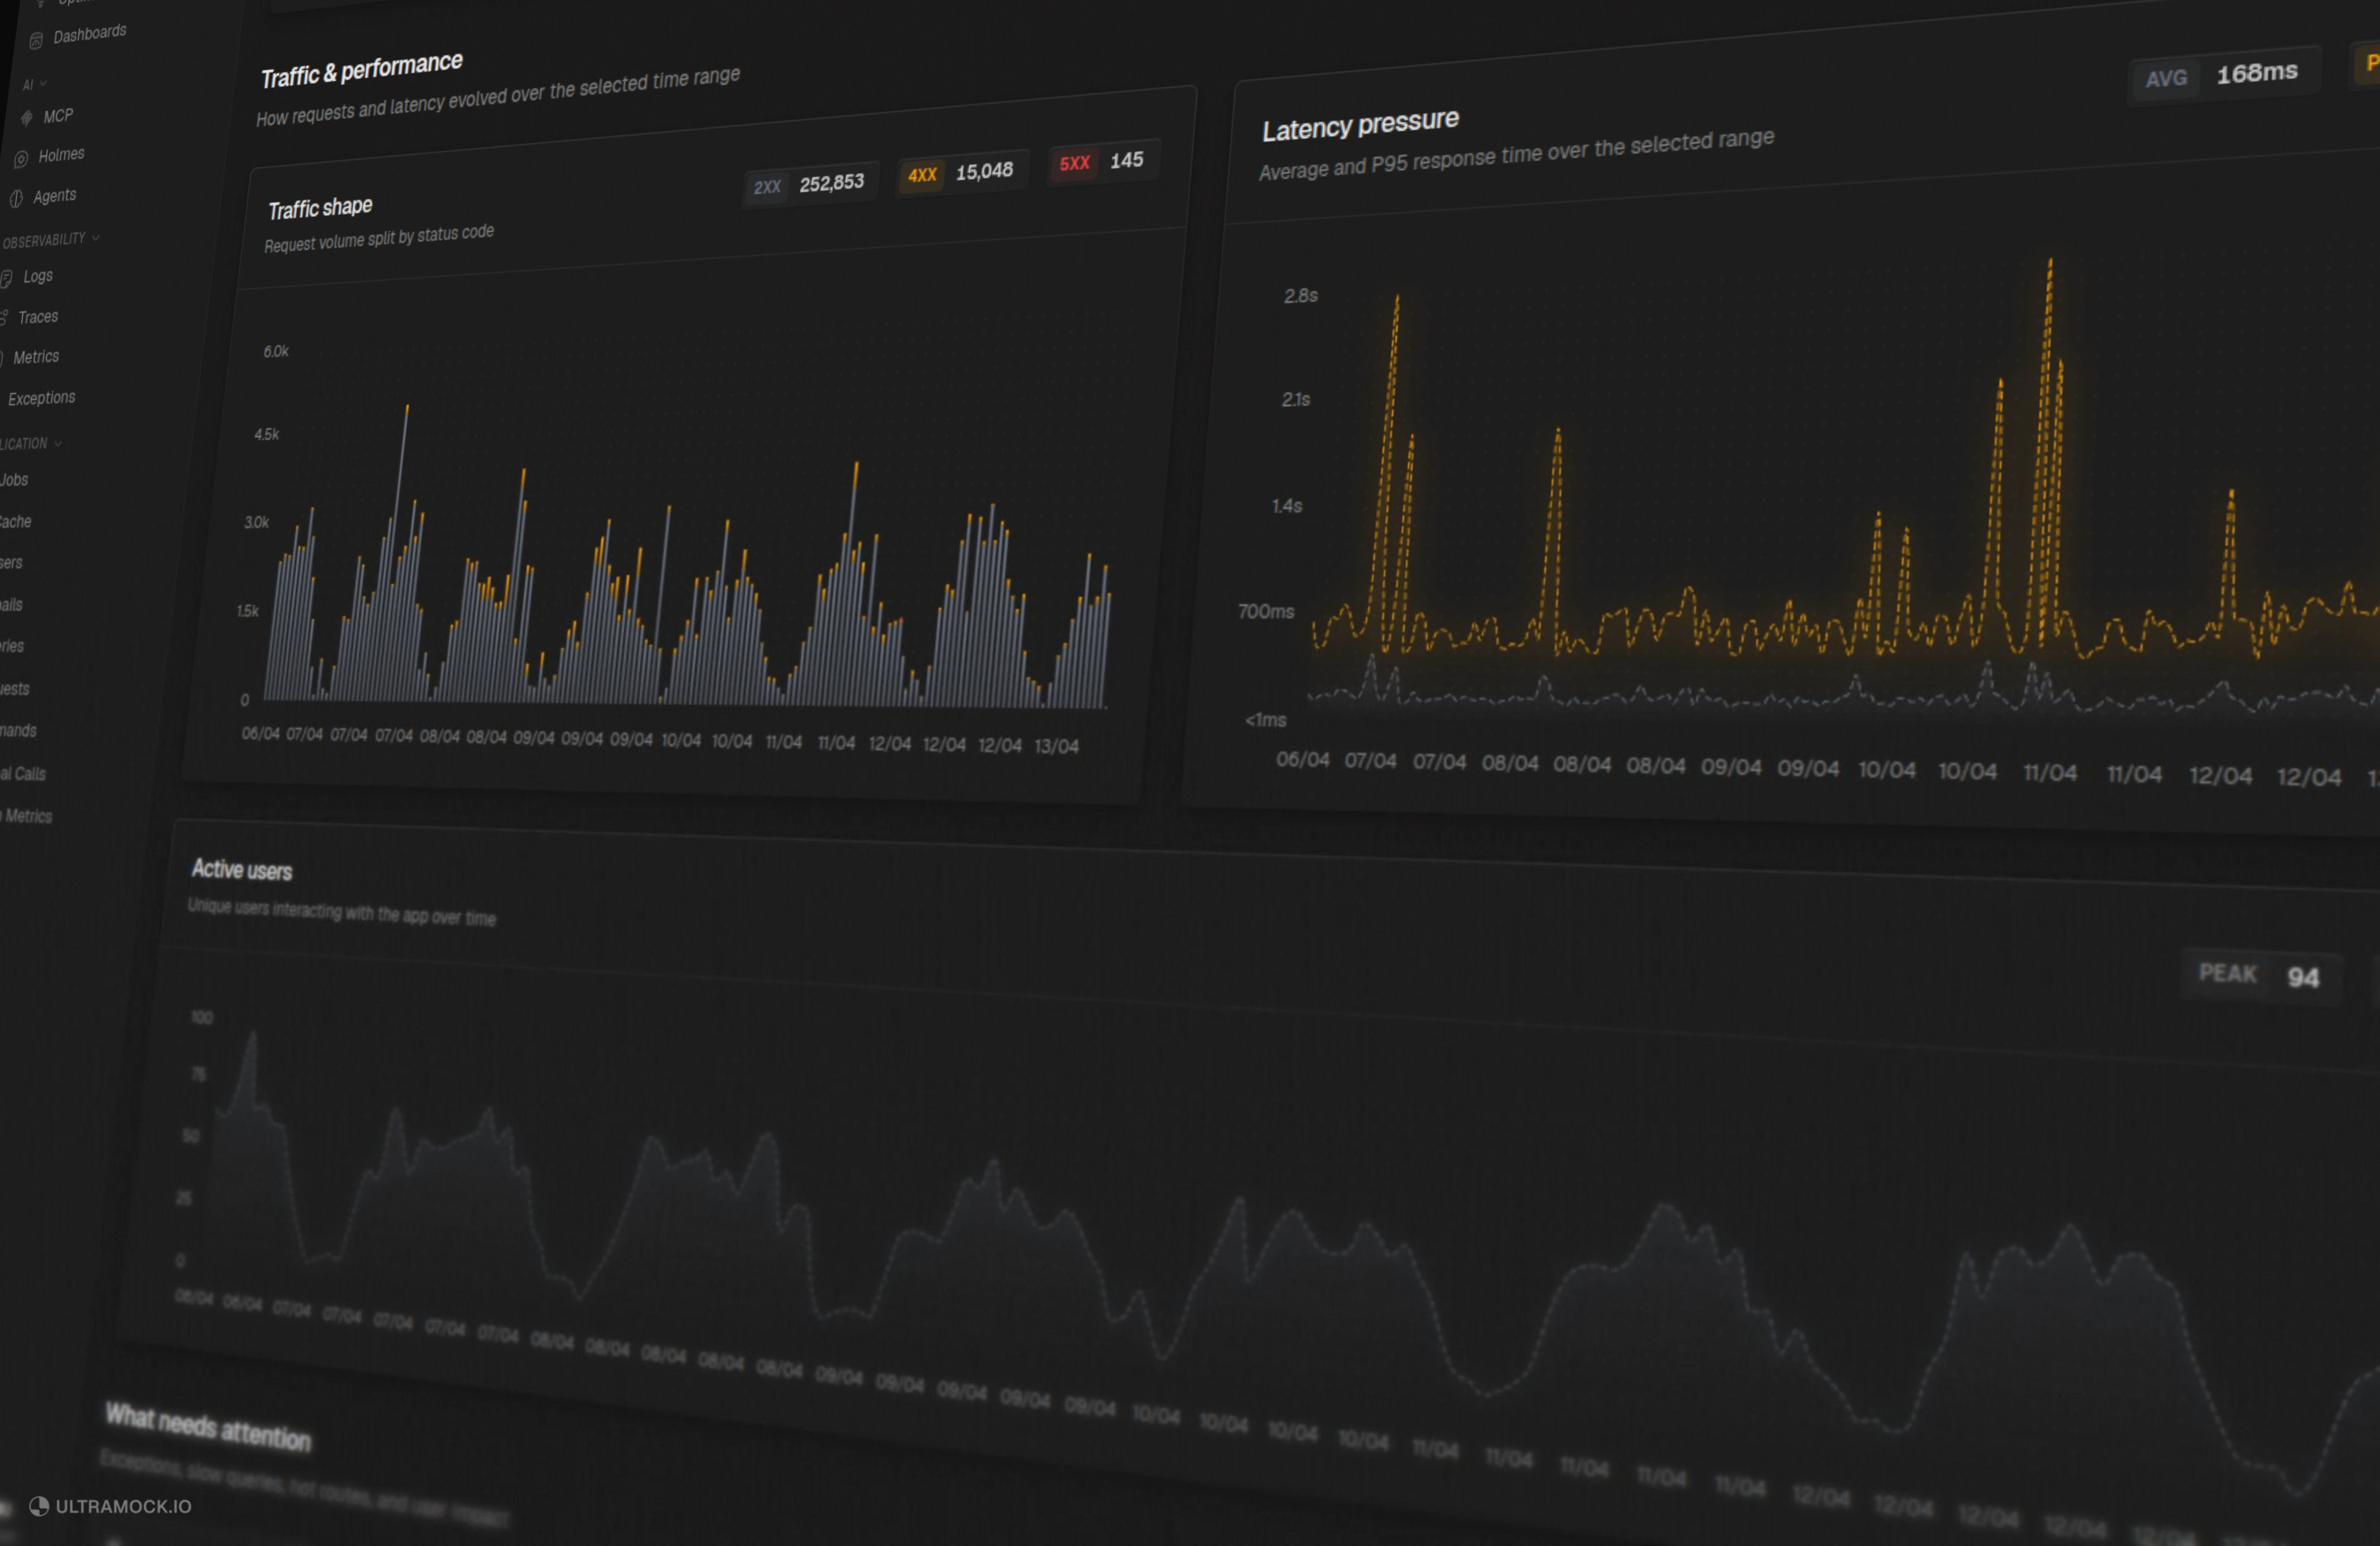
Pre-built dashboards
Most observability tools give you a blank canvas and wish you good luck. Monocle takes a different approach: you get dashboards the moment your data starts flowing.
Here's what's available out of the box:
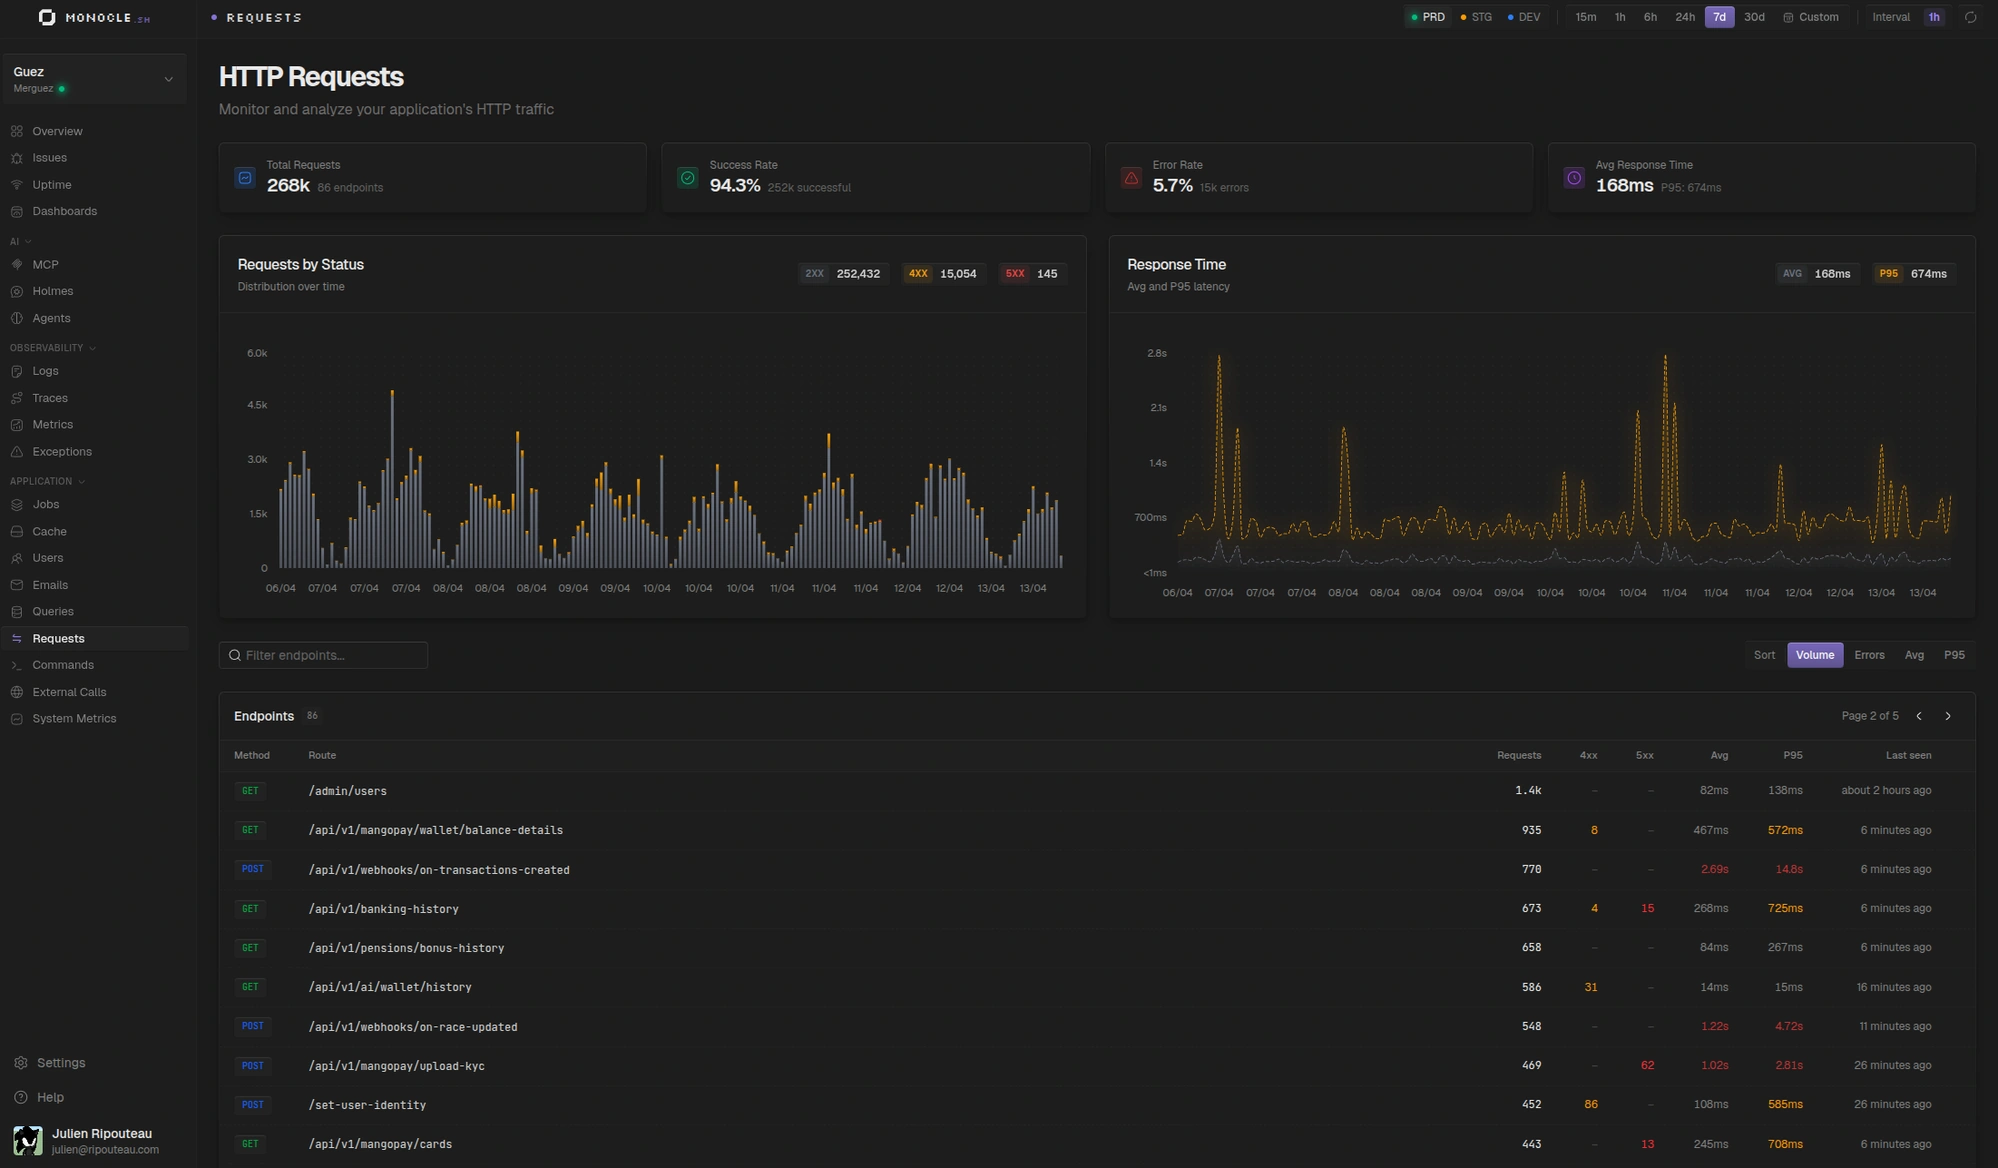
- HTTP requests: response times, P95 latency, status codes, slow endpoints
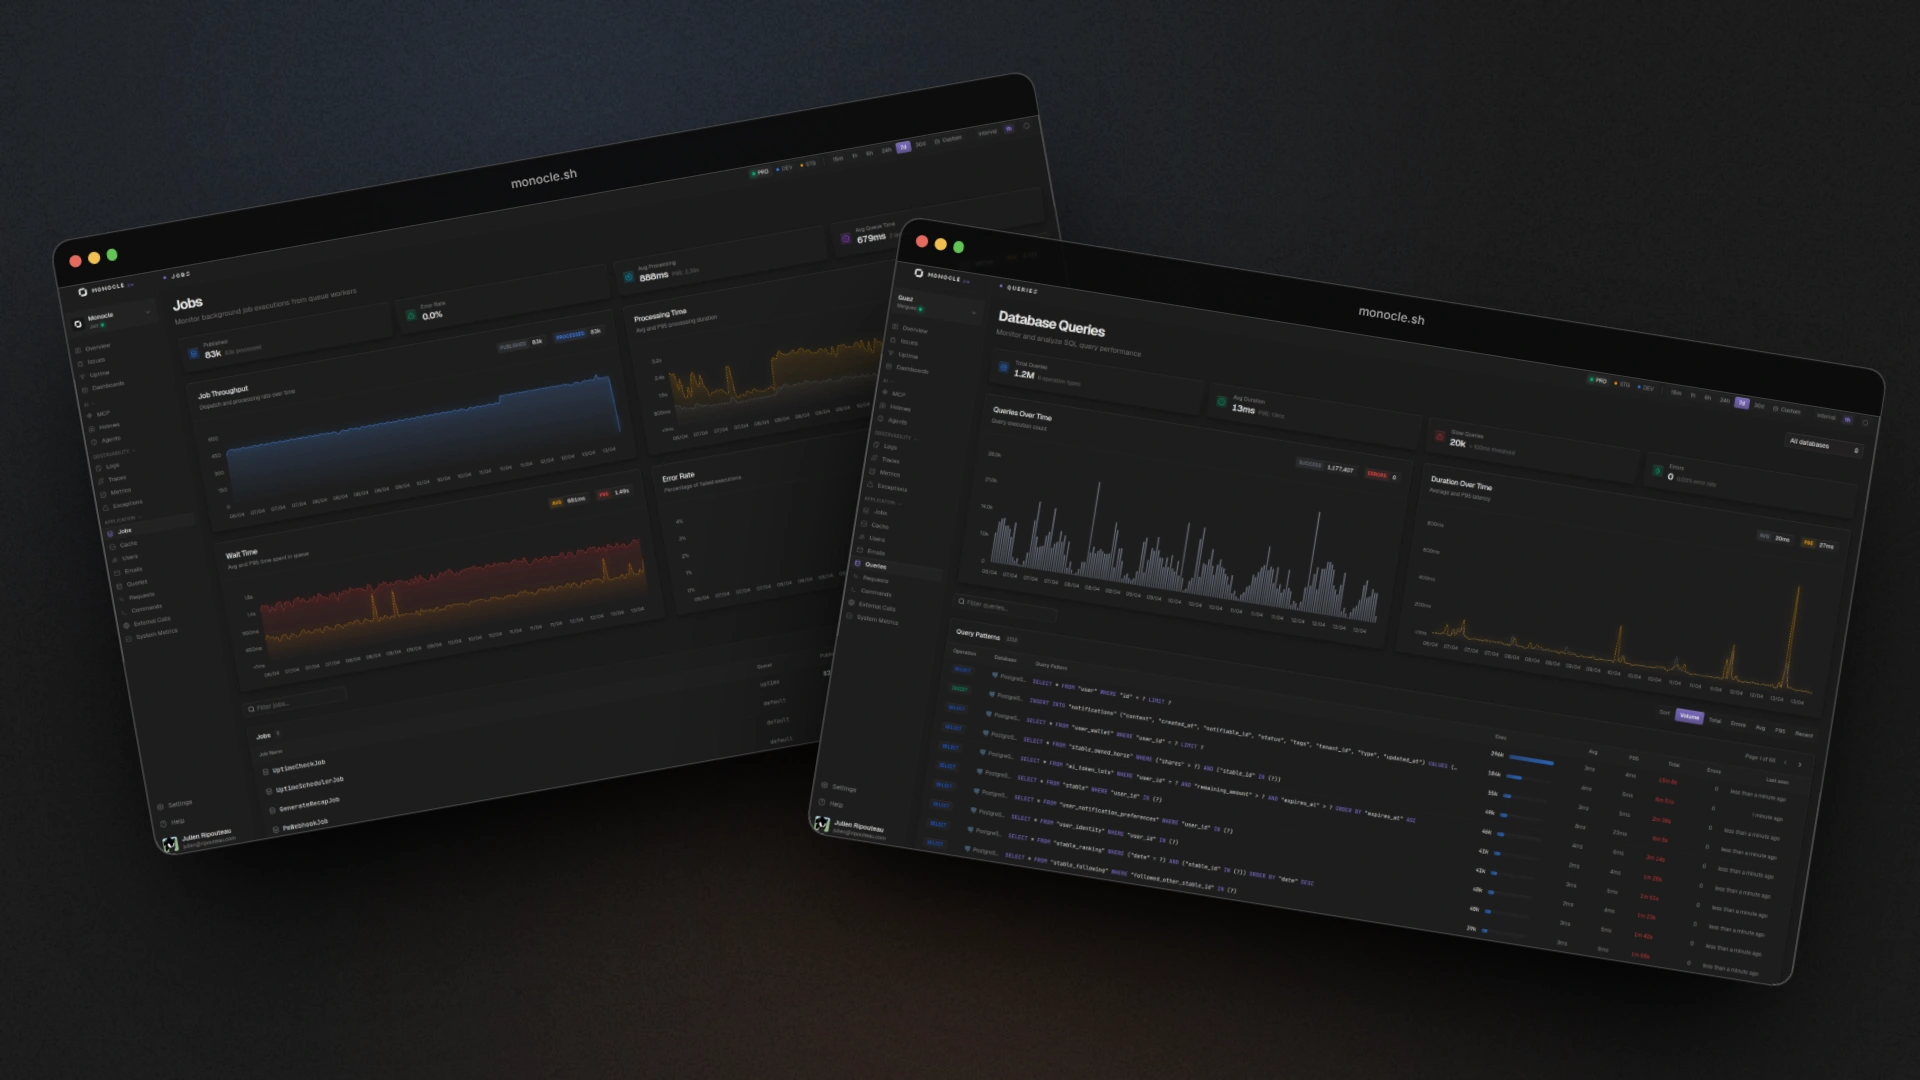
- Database queries: query patterns, N+1 detection, slow queries
- Background jobs: execution tracking, failure rates, processing times
- Cache: hit/miss rates, latency per key
- User tracking: see which users are experiencing the most errors or slow requests
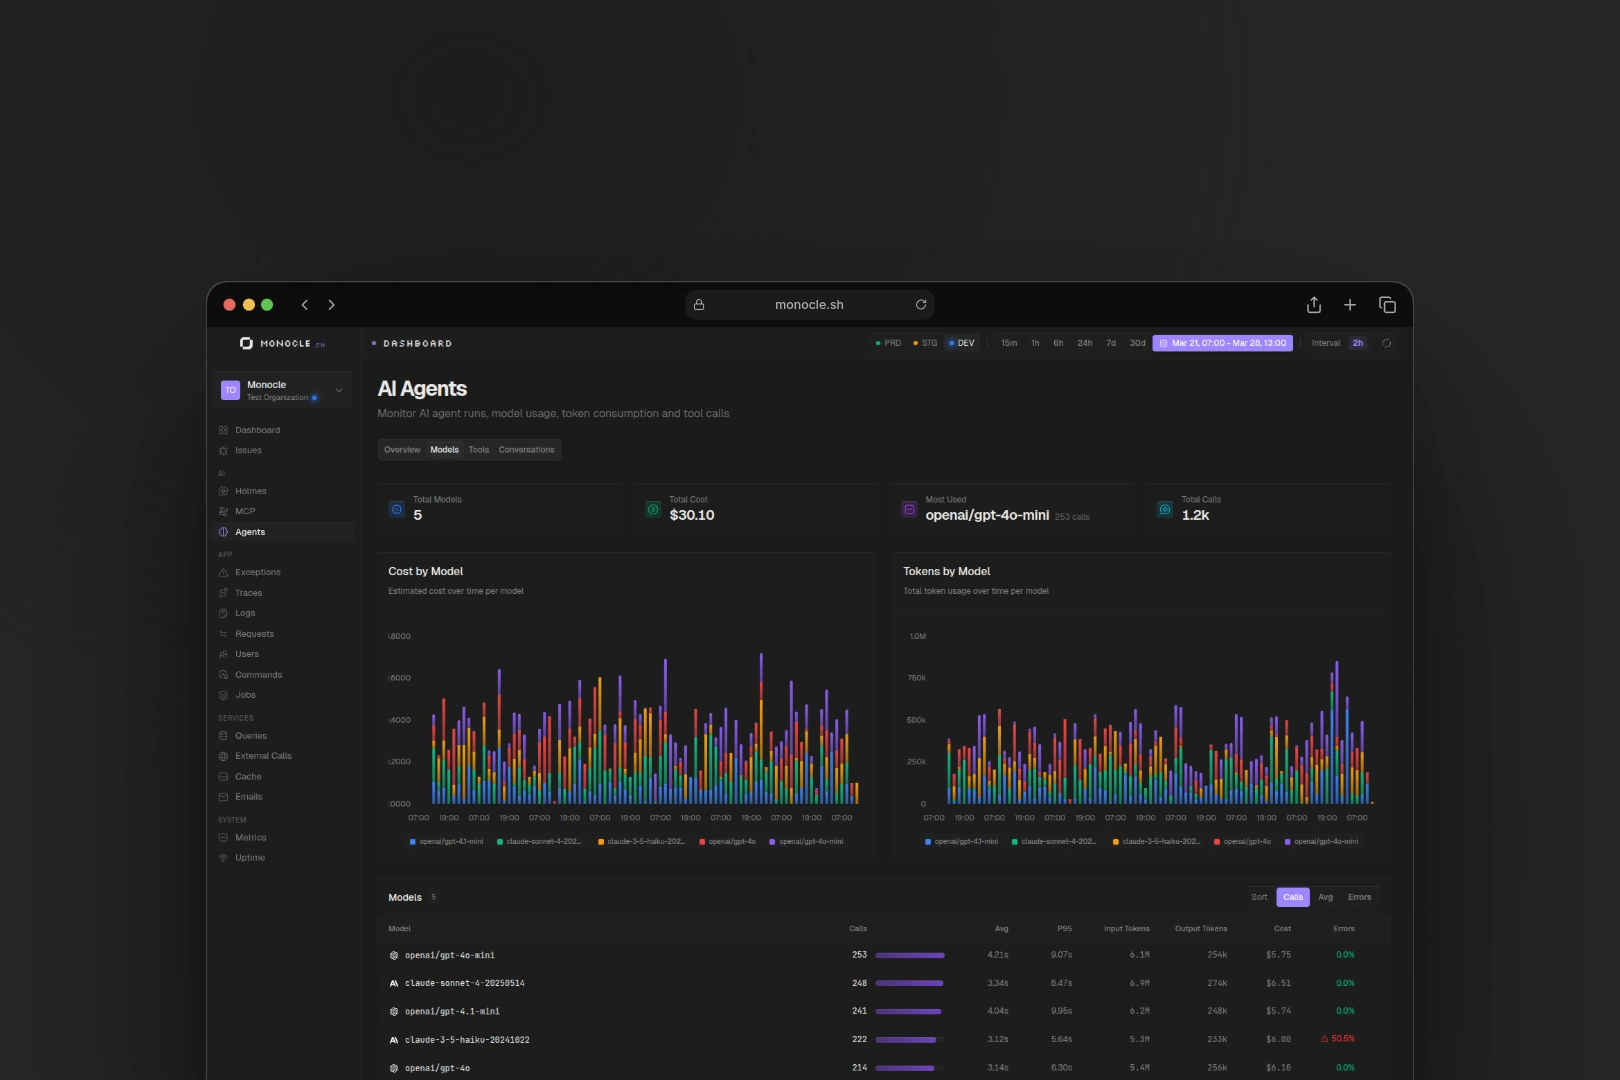
- Agentic workflows: if you're running AI agents, you get a dedicated dashboard to monitor tool calls, model usage, token counts, costs and so on
- External API calls: third-party response times and error rates
- Emails: delivery tracking
- CLI commands: execution and error tracking
- System metrics: CPU, memory, heap usage, event loop utilization
- And more...
No "create a panel, pick a data source, write a PromQL query, adjust the time range, oh wait the legend is broken, let me just rewrite this dashboard from scratch". It's just there.
When you need something more specific, there's also the classical drag-and-drop dashboard builder with multiple chart types, multi-query widgets, and full OpenTelemetry metrics support. But honestly, the pre-built ones cover the 90% case.
Tip
Want to build your own custom dashboard? Just ask your AI assistant. Monocle's MCP server exposes tools for that.
Exception tracking
Every error gets captured, grouped, fingerprinted, and displayed with the full stack trace. See which errors are happening the most, which users are affected, which endpoints or jobs are causing those errors.
You can also link exceptions directly to GitHub Issues or Linear. Create a ticket from an error in one click. When the issue gets closed on the other side, Monocle knows. No manual status syncing.
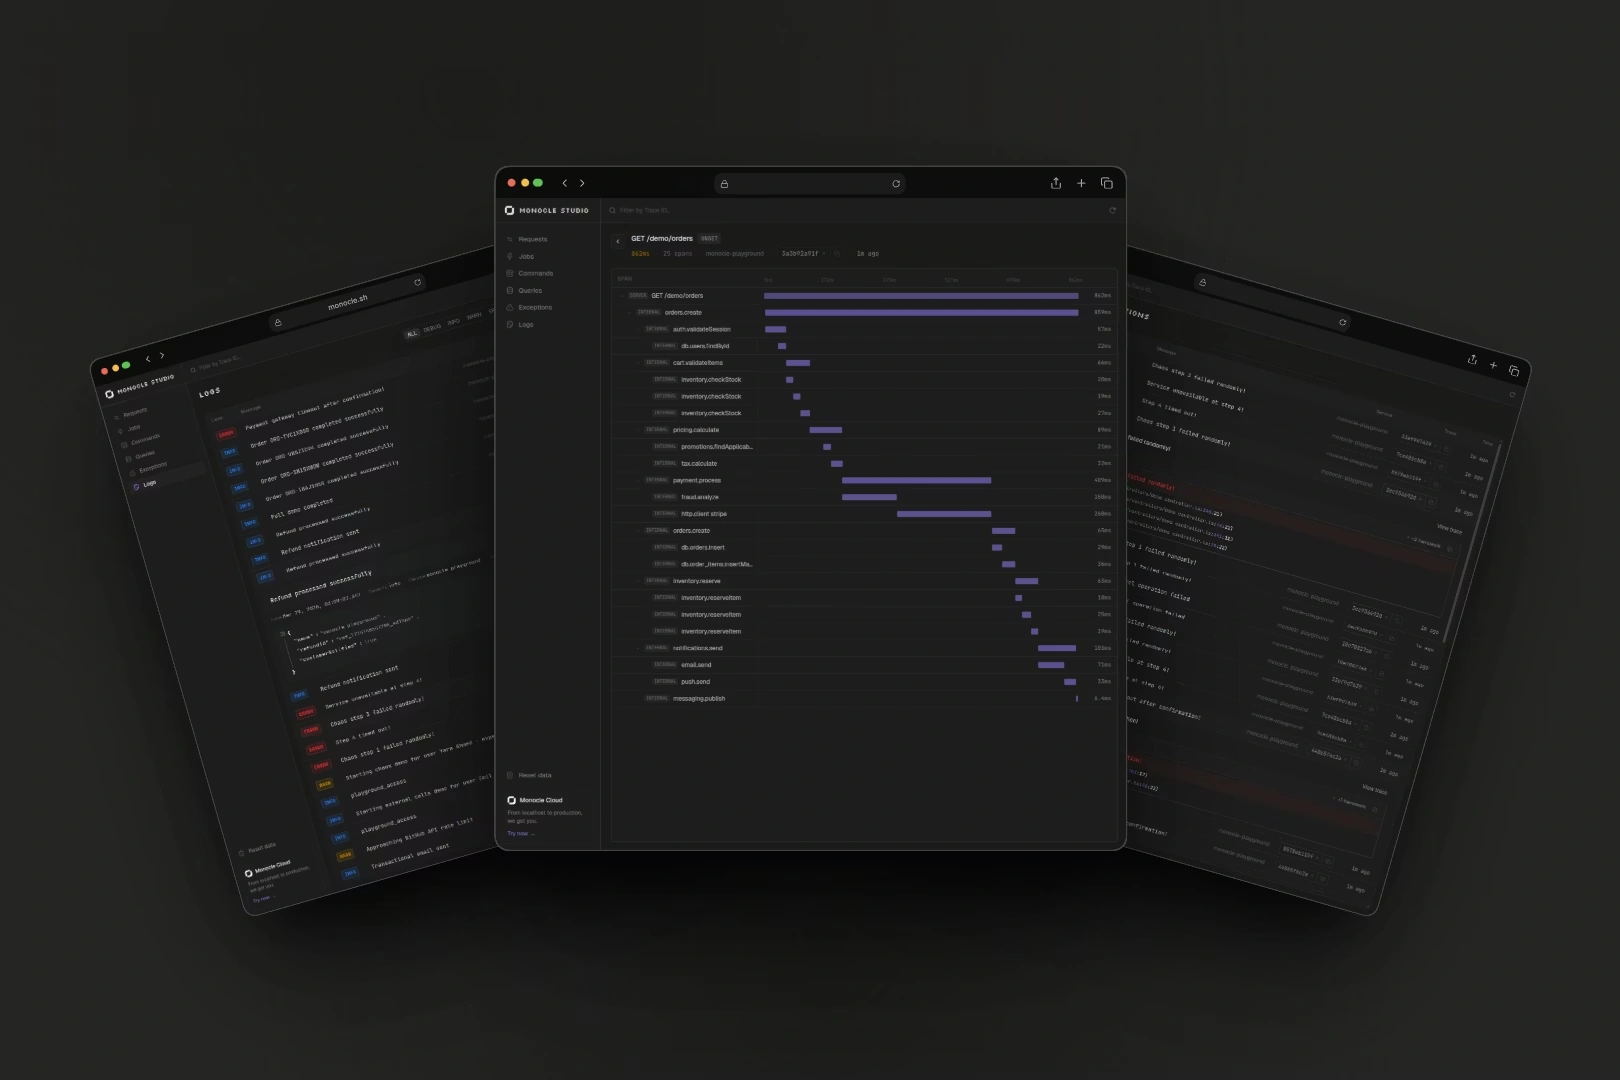
Traces and logs
Of course, full distributed tracing with a waterfall view. Because traces and logs are correlated, you can jump from any trace to the exact logs that happened during that request, filtered by span.
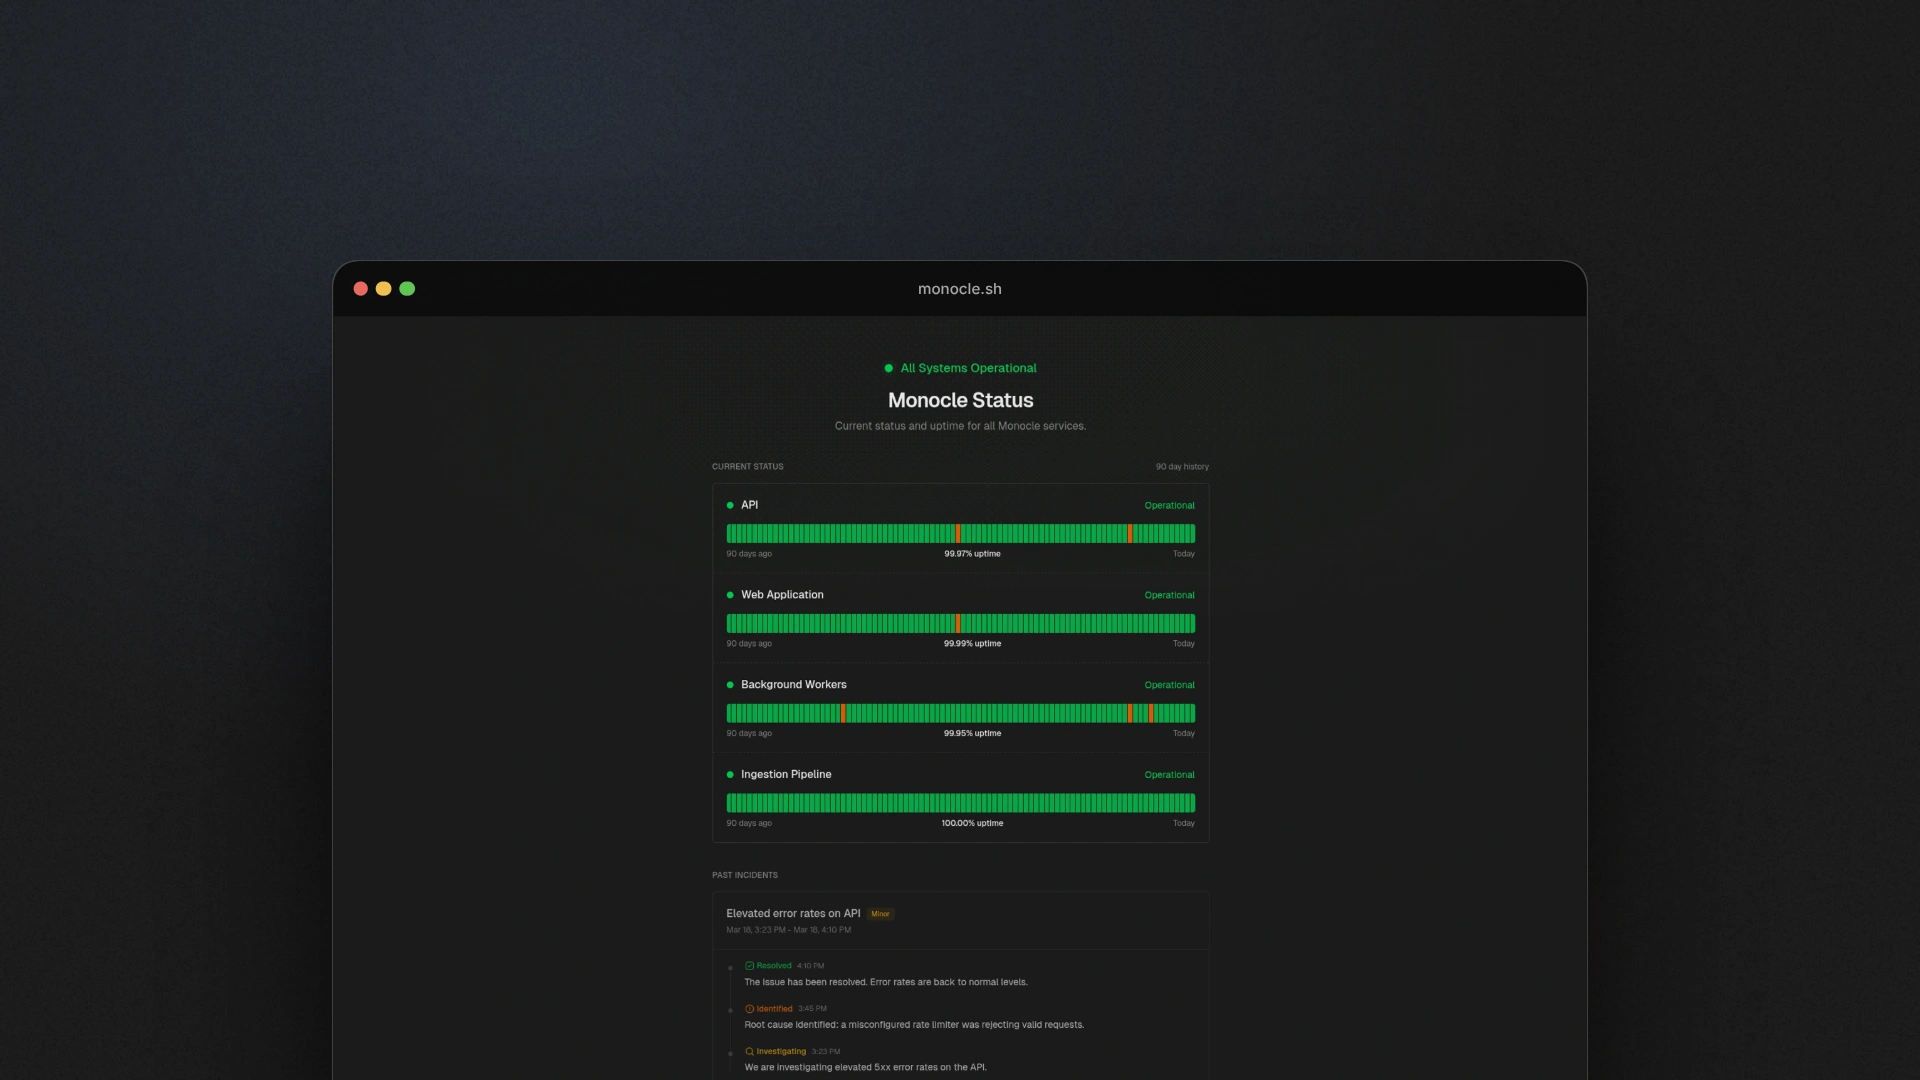
Uptime monitoring and status pages
Monitor your endpoints. Get alerted on Slack or Discord when things go down. Give your users a public status page with incident timelines. Not another separate tool with another subscription and another login.
AI integration
Monocle ships with a powerful MCP server. Your AI assistant can now browse your traces, query your logs, analyze exceptions, and even build dashboards for you.
Honestly this one is a game changer for me. I can ask my assistant "which endpoints are the slowest right now?", "show me slowest database queries for user 123", "which errors are happening the most for user 456?", "build me a dashboard with response times and error rates for the last 24 hours". And it just does it.
AI observability
AI agents and MCP servers are everywhere now, but nobody really knows what's happening inside them. How much are they costing you? Which models are being called? How many tokens per conversation? Which tools were called, and what are the inputs and outputs?
Monocle answers all of that. If you're running an MCP server, Monocle can instrument it and give you full visibility: every tool call, every conversation, every token. Same thing for agentic workflows: if your app is making LLM calls (OpenAI, Anthropic, whatever), you get a dedicated dashboard that breaks down cost by model, tokens by model, and traces every single agent interaction.
Monocle Studio
Here's the thing not a lot of people are talking about: observability shouldn't only be a production thing. When you're developing locally, you want to see what's happening too. Which queries are running, what spans are being created, what's unexpectedly slow.
Monocle Studio is a local dashboard that runs on your machine. No Docker, no cloud account, no API key.
monocle studio devSame agent, same auto-instrumentation, but everything stays local. And the cool part: it has its own MCP server too, so your AI assistant can see your local telemetry while you're coding. I've seen a ton of tools over the last few months trying to let agents read dev server logs. Most of them are hacked together and limited. With Monocle Studio, not only can your agent read logs with zero config, but it can also see traces and detect potential performance issues before the code even hits staging.
Studio also comes as a desktop app, so you don't even need to keep a terminal open. Just launch it and it sits in the background, ready to capture everything your app does.
What does this mean for AdonisJS?
Monocle was built for (and with!) AdonisJS. Not as an afterthought, not as a "yeah we also support that framework" thing. The agent works with both Adonis 6 and Adonis 7. Auto-instrumentation covers HTTP, Lucid queries, queues, mails, everything. Zero config.
But building Monocle also meant building a lot of tooling that didn't exist yet in the ecosystem. We're planning to open source several libraries over the coming weeks that were born from this project:
- Improved
@adonisjs/otel: a more complete OpenTelemetry integration for AdonisJS - Sesame: an OAuth 2.1 + OIDC library. We built it to power Monocle's MCP server authentication, and it's ready to stand on its own
- Facteur: a notifications library. Emails, Slack, Discord and others under one API. Battle-tested in Monocle's alerting system
- Tenace: let's just say it makes resiliency and concurrency way less painful. More on this soon
All of these were built because I needed them. They'll get proper releases, docs, and their own announcements. Stay tuned!
What's next
We're early but moving fast. Here's what's coming:
- Free plan: everyone should be able to try Monocle without pulling out a credit card.
- More frameworks: there's already an experimental Effect agent in the works, and we're exploring what comes after
- Even more auto-instrumentation: if your framework does it, we want to track it automatically
- Frontend observability: a browser SDK is in the works, with its own set of dashboards tailored for frontend. Web Vitals, client-side errors, page load performance, and user sessions. A completely different experience from backend monitoring.
- Better alerting: smarter notifications, more channels, less noise
- More AI features: the MCP server is just the beginning. We have big plans to leverage AI for observability in ways that haven't been done before. Foundations for that are already in place, but it's going to be an exciting journey.
Wrapping up
Monocle is live and already processing 15M+ events per day for several companies in production. Is it perfect? Definitely not. There are rough edges, things to polish, features to add. But it works, and already changed how I build and debug stuff every day.
Fun fact
Monocle is monitoring itself right now. Every trace, every error, every slow query, we see it through our own dashboards. It's been an amazing feedback loop for improving the product.
We're opening access gradually through a waitlist, gotta make sure the infra scales properly and that we can onboard new users with a good experience. If you want to be among the first to try it, join the waitlist:
Ready to fix your observability?
Join the waitlist and get early access to Monocle.
Got questions, feedback, or just want to talk shop? Find me on Twitter/X and follow the Monocle account for updates.